

Kagenmi/iStock via Getty Images
By Garey J. Aitken, CFA & Timothy W. Caulfield, CFA
Cyclical Strength Sparks Canadian Rally – Market Overview
Canadian equities continued their advance in the third quarter despite ongoing global trade uncertainty and geopolitical risks in the Middle East. The S&P/TSX Composite Total Return Index (TRI) jumped 12.5%, reaching a new all-time high on the final day of the quarter. Strength in Canadian equities was broad based, with new records set by seven of 11 Canadian GICS sectors: energy, materials, industrials, consumer discretionary, consumer staples, financials and utilities. Notably absent from this list were information technology (IT), health care, communication services and real estate, which have yet to recover to previous highs.
The U.S. dollar recovered from some of its prior-quarter decline against the Canadian dollar, rising 2.3% in the third quarter to $1.39 USD/CAD, though it remains down 3.2% year to date. While a softer U.S. dollar typically reduces the translated value of U.S.-based earnings, the impact on Canadian equities is more nuanced, particularly given its influence on commodity markets such as gold and copper. Heightened policy uncertainty from the U.S. administration, ranging from trade measures that weaken the dollar’s “safe haven” status to concerns over fiscal deficits and mounting debt, has added another layer of volatility.
In Canada, the persistence of U.S. tariffs has sustained uncertainty regarding the momentum of future economic activity, with outcomes hinging on how extensive and prolonged the trade dispute proves to be. Canada’s economy displayed modest improvement in July, with GDP growth tempered by still-elevated unemployment and subdued inflation. Overall, Canada’s third-quarter macro backdrop reflected slightly better sentiment compared to the second quarter, though conditions for equities remained nuanced. Benchmark 10-year yields slipped, down 9 basis points to 3.18%, well below their October 2023 highs of 4.24%. On both sides of the border, anticipated monetary easing materialized, generally viewed as supportive for equities. Both the Bank of Canada and the Federal Reserve delivered rate cuts in the quarter, with the Bank of Canada now lowering rates eight times this cycle to a neutral 2.50% to stimulate housing and consumption.
On an absolute return basis, the Canadian equity market’s advance was broad based, with 10 of 11 GICS sectors having increased in the third quarter. Materials (+37.8%), IT (+13.2%) and energy (+12.6%), were the three best-performing sectors. Meanwhile, industrials (-1.4%), consumer staples (+1.6%) and consumer discretionary (+3.7%) were the worst performers. In materials, surging commodity prices drove strong gains for gold producers, with additional support coming from solid performance in copper producers. In IT, Canadian tech stocks continued a volatile but ultimately positive wave. The global tech rally, especially U.S. mega-cap tech and perceived winners and losers of artificial intelligence (AI), spilled into the Canadian market to a degree.
In energy, strength across producers, infrastructure and services was seen despite the volatility in crude oil and natural gas prices that ended the quarter at US$62.37/bbl (West Texas Intermediate) and US$3.30/mmbtu (NYMEX). This represented a 4.2% and 4.4% decrease in oil and natural gas, respectively. Gains came from improving sentiment driven by the new Carney Liberal government’s more constructive stance toward the sector, which should support easier permitting and approval of new egress options for the basin. Improved market access for the commodities would lead to better realized prices for producers and make future growth plans more palatable to investors.
Weakness in the Canadian rails weighed heavily on industrials performance. Consumer-oriented sectors also lagged, although several discretionary stocks with cyclical exposure rebounded from the previous quarter’s lows following heightened trade tensions and tariff concerns after Liberation Day. This was tempered by diminished sentiment for the defensive pockets of the market, like consumer staples, which declined as investors favored riskier assets.
Performance Overview
The ClearBridge Canadian Equity Strategy underperformed the benchmark in the third quarter. The Strategy’s cyclical exposure was a primary detractor, most notably in materials. Gold bullion continued its ascent in the third quarter, finishing at US$3,873 per ounce, up 17.1% in the quarter and 46.6% year to date. As is typically the case given that we struggle to find gold-related equities with the requisite fundamentals or valuations, the Strategy is meaningfully underweight the gold subindustry, which ended the quarter with a 12.7% weight in the index. The Strategy’s gold-related holdings, Agnico Eagle Mines (AEM) and Franco-Nevada (FNV), were both strong performers year-to-date.
In industrials, Canadian National Railway (CNI) and Canadian Pacific Kansas City (CP) together account for roughly 35% of the sector benchmark; both were pressured by softer shipping volumes, trade uncertainty and lingering macroeconomic headwinds causing both companies to lower guidance in 2025.
In energy, commodity price volatility and weakness resulted in poor performance for our holdings. Stronger performance from Parex Resources (OTCPK:PARXF) and Cenovus Energy (CVE) was not enough to offset weaker overall performance from our natural gas-focused producers, ARC Resources (OTCPK:AETUF) and Tourmaline (OTCPK:TRMLF).
In IT, larger detractors included our underweight positioning to sector leader Shopify (SHOP), underperformance from CGI (GIB) and not owning the outperforming Celestica (CLS). Shopify saw strong momentum in parallel to U.S. large cap technology stocks, with continued strong execution and an announced partnership with OpenAI (OPENAI) helping shares. Celestica, a rare AI play in Canada (hardware-oriented), continues its march higher as spending on data center infrastructure and demand from hyperscalers created tailwinds.
Financials was the Strategy’s best contributor in the third quarter. Strong security selection came from not owning underperforming Sun Life Financial (SLF) and Fairfax Financial (OTCPK:FRFHF), as well as an overweight in Bank of Montreal (BMO). The large Canadian banks as a whole saw strong performance in the third quarter: BMO kept pace with peers as the outlook for credit losses moderated, capital markets activity rebounded and excess capital positions enabled return on equity improvements via buybacks.
Portfolio Positioning
Four holdings were involved in corporate actions during the quarter. Parkland Corp. (OTCPK:PKIUF) announced a definitive agreement in the second quarter to be acquired by Sunoco LP (SUN) in a cash-and-equity transaction. With the market price reflecting a balanced risk/reward post-offer, we exited our position. MEG Energy (OTCPK:MEGEF) became the subject of an unsolicited bid from Strathcona Resources (OTCPK:STHRF), which was rejected by MEG’s board as inadequate. Cenovus, another of our holdings, subsequently made a competing offer, viewed as strategically superior and with a more balanced risk profile. During the previous quarter, TELUS Digital got its first non-binding proposal from its parent company, TELUS, which was subsequently improved. As the deal was solidified, we exited our position. Finally, Teck Resources and Anglo American agreed to a merger of equals that would create a global mining leader with 70% copper exposure and meaningful synergies from adjacent assets, though the timeline, interest from third parties and consent from the Canadian government remain uncertain.
Trading activity in the Strategy picked up as the environment provided compelling opportunities to both scale into and pare back positions. We selectively increased exposure to several out-of-favor cyclical stocks that faced significant pressure, while at the same time trimming resilient defensive sectors, including consumer staples and utilities. By adding higher-beta exposure on weakness and reducing lower-beta holdings on strength, the overall result was an intentional tilt toward greater “risk” at attractive valuations, lifting the Strategy’s ex-ante beta to slightly above the midpoint of the 0.8 to 0.9 target band. Although turnover is usually modest, we remain prepared to act decisively whenever conditions create compelling entry or exit points.
In financials, we initiated a position in EQB (OTCPK:EQGPF) and added to our existing positions in Manulife Financial and Intact Financial. For EQB, following the unexpected passing of long-term CEO Andrew Moor, which increased volatility and led to share price weakness in the quarter, we were able to initiate a position at an attractive entry point. EQB is Canada’s leading digital-first bank, delivering above-average growth through innovative online banking, mortgages and commercial lending. Its asset-light, technology-driven model allows it to operate with lower costs and higher efficiency than traditional peers. The company has delivered strong earnings growth and a high return on equity, supported by prudent risk management and expanding customer adoption.
In utilities, we exited our remaining position of ATCO (OTCPK:ACLLF) on share price strength, noting that we have previously built a position in Canadian Utilities, an operating subsidiary of the company and its largest investment as we considered it to be relatively more attractively valued. Competitively positioned in its core markets, Canadian Utilities has established a strong track record of operational excellence, generating higher returns than regulatory allowances. The company is well-positioned to leverage its asset base, industry expertise and partnerships to advance both its strategic and financial objectives.
In real estate, we exited our remaining position in Allied Properties (OTC:APYRF). The company continues to face a difficult Canadian office market, characterized by elevated vacancy rates and subdued leasing demand, even before factoring in the added uncertainty from tariffs. During this period of sustained weakness, Allied expanded its balance sheet by acquiring properties and related mortgages from a joint venture partner that was unable to service its debt. To manage the higher leverage, the company plans to pursue asset dispositions, though this comes at the cost of future development and growth potential. Rising interest expenses combined with soft leasing trends are expected to weigh on earnings going forward.
At quarter end, the Strategy’s largest sector exposures were financials, industrials and energy. Relative to the benchmark, the Strategy is overweight the industrials sectors and the generally defensive/non-cyclical consumer staples and utilities. The Strategy is most underweight the typically value/cyclical materials and financials sectors.
Strategy and Outlook
Canadian equity markets continued to build on year-to-date strength in the third quarter, supported by resilient corporate earnings and a backdrop of shifting global dynamics. While political uncertainty in the U.S. under the Trump administration created volatility across asset classes, the Canadian equity market, as well as our Strategy more broadly, delivered strong absolute returns. Against this backdrop, sector leadership has remained concentrated, with materials and IT capturing investor attention. Investor sentiment, though cautious, has shown signs of resilience as macro headwinds and political risks are increasingly priced into expectations.
Exhibit 1: Tariff Risks Sparked Roller Coaster Ride Across Sectors
As of Sept. 30, 2025. Source: ClearBridge Investments, FactSet.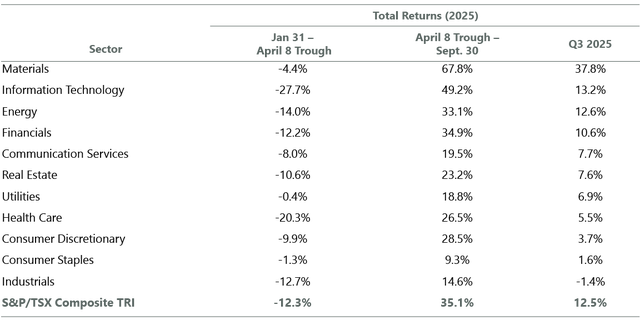
In times of market uncertainty, such as the unpredictability of the current U.S. administration, it is essential to maintain a long-term perspective. Avoiding short-term distractions and remaining decisive in the face of both risks and opportunities is key. This includes a disciplined approach to valuation, guided by discounted cash flow analysis, with an emphasis on equities trading at a meaningful discount to our estimate of intrinsic value. We focus on high-quality companies with clear potential for future profitability, sustainable long-term growth, prudent capital allocation and a balanced risk-reward profile. We continue to emphasize predictability and downside protection while maintaining reasonable valuations. This approach supports portfolio stability and outperformance during periods of market volatility, while allowing flexibility to capture developing opportunities.
Portfolio Highlights
During the third quarter, the ClearBridge Canadian Equity Strategy underperformed its S&P/TSX Composite TRI benchmark. On an absolute basis, the Strategy generated gains in eight of the 10 sectors in which it was invested (out of 11 total). The primary contributors were the financials, materials and IT sectors, while the main detractor was industrials.
Relative to the benchmark, overall stock selection and sector allocation detracted from performance. In particular, an underweight to materials, overweights to industrials and consumer staples and selection in materials and energy had the most negative impacts. On the positive side, selection in financials, consumer staples and real estate and underweights to financials and consumer discretionary contributed to performance.
On an individual stock basis, leading relative contributors included Franco-Nevada, Constellation Software and Open Text and not holding Thomson Reuters and Sun Life Financial. Top relative detractors included Canadian National Railway, Shopify and CGI and not holding Barrick Mining and Kinross Gold.
Garey J. Aitken, CFA, Managing Director, Head of Canadian Equities, Portfolio Manager
Timothy W. Caulfield, CFA, Managing Director, Director of Canadian Equities Research, Portfolio Manager
|
Past performance is no guarantee of future results. Copyright © 2025 ClearBridge Investments. All opinions and data included in this commentary are as of the publication date and are subject to change. The opinions and views expressed herein are of the author and may differ from other portfolio managers or the firm as a whole, and are not intended to be a forecast of future events, a guarantee of future results or investment advice. This information should not be used as the sole basis to make any investment decision. The statistics have been obtained from sources believed to be reliable, but the accuracy and completeness of this information cannot be guaranteed. Neither ClearBridge Investments, LLC nor its information providers are responsible for any damages or losses arising from any use of this information. Performance source: Internal. Benchmark source: Standard & Poor’s. |


