

Crude Oil: The Barrel Likes $80
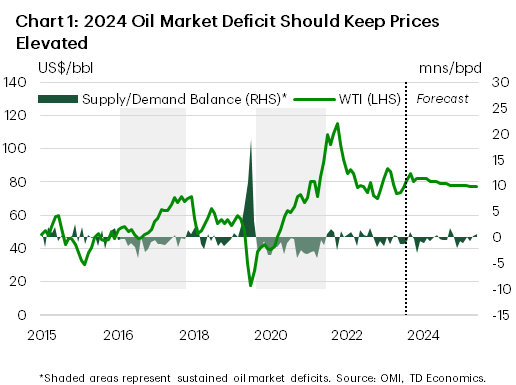
For the most part, crude oil prices have been trading at the $75-85/bbl level since the start of this year. This relatively stable range has reflected several competing factors, including tight markets and waning concerns around potential oversupply on the one hand and worries about faltering OPEC+ coordination and a questionable demand outlook on the other. Taking stock of the balance of risks, we are comfortable with our $80/bbl average for 2024, before prices pull back modestly next year.
OPEC+ production compliance hasn’t been perfect, but most producers have pulled their weight. Since late 2022, the group has implemented policy to curtail around 6 million barrels per day (bpd) of oil through a mix of quota reforms, Saudi-led voluntary reductions, and export caps. These measures have given some degree of flexibility to OPEC+ members, which has helped keep compliance levels above 90%. Against this backdrop, oil markets are running slightly undersupplied– and likely will for most of the year– which is keeping prices fundamentally supported (Chart 1).
However, the OPEC alliance likely isn’t satisfied yet. It is no secret that Saudi Arabia is aiming to keep a floor under oil prices, but previous episodes of upward price momentum failed to have any staying power. Current production cuts are set to be in place until June 2023 with no stated intention (yet) to move off of their current policy stance. Now, it’s becoming increasingly likely that OPEC+ will extend cuts into the third quarter, before gradually raising output in the fourth quarter amid high levels of spare capacity and an expectation of tightening physical markets.
Not to be overlooked is the ongoing geopolitical tension in the Middle East, which has periodically pressured prices higher in the last two quarters. We still view the potential for uncontrolled price surges due to escalating conflict as a tail-risk. As tensions mount, markets are quick to tack on an average $5–7/barrel premium, but that premium tends to evaporate at any signs of de-escalation. If material supply disruptions do result from conflict, OPEC+’s high level of spare capacity could act as a backstop.
Much of the forecasting community expected increased oil supply from non-OPEC+ sources this year to offset the impact of the cartel’s output cuts–but so far this has not come to fruition. U.S. shale is struggling to keep pace with last year’s rapid growth and the likes of other major producers such as Brazil, Canada, and Guyana have not been able to make up for lost barrels. Demand on the other hand is holding up relatively well on the back of an uptick in Chinese economic activity and some early signs of a pickup in global manufacturing. Across major oil watching agencies, demand estimates vary with OPEC projecting the strongest global demand at 2.25 million/bpd and the EIA and IEA at roughly half of that.
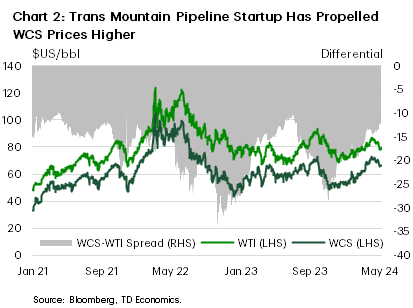
Domestically, WCS prices have gained ground on its WTI counterpart due in large part to the official Trans Mountain Pipeline (TMP) startup. The spread to WTI, historically running at $18-20/bbl, has narrowed to $12–13 /bbl (Chart 2) which will continue to incentivize production and support industry profitability. We see the price differential averaging $14/bbl in 2024, a $4/bbl improvement from last year’s average.
Natural Gas Found Its Bottom
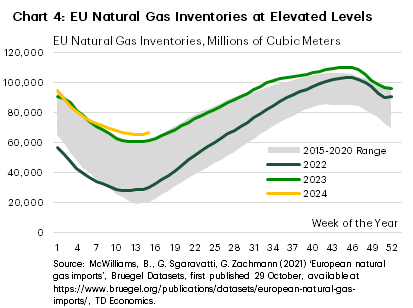
Natural gas prices have fluctuated considerably over the past year with the North American benchmark Henry Hub slipping by around 40% from last year’s high of $3.80/mmbtu. Overall, a mix of below-average levels of consumption due to a mild winter and already-bloated inventories have driven the broad deterioration in prices. However, at the current US$2.35/mmbtu, prices have staged a decent rally since bottoming out in March, with a slight upward trajectory expected for the remainder of the year and into 2025. The European benchmark Title Transfer Facility (TTF), currently at US$9.50/mmbtu, is roughly flat year-to-date and well off the US$90/mmbtu peak from August 2022. As a result of blunted demand, natural gas storage levels in the U.S. and the EU are hovering well above their 5-year average levels (Chart 3 and 4).
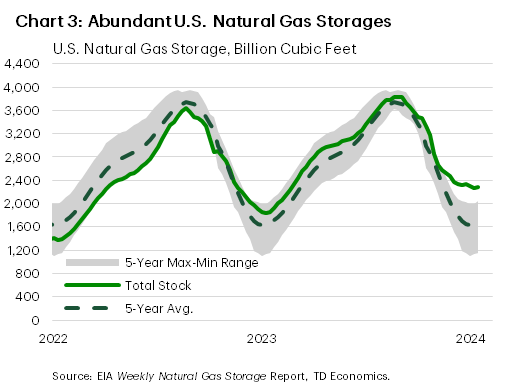
April marked the beginning of the storage injection season – the 6-month period ending in October where gas demand generally decreases alongside continued production. This year’s injection levels are expected to be less than the historical fill rate, but inventories are still expected to be left about 10% above their 5-year average by season’s end. In spite of this, relatively flat U.S. natural gas production over the year combined with a slight increase in consumption in the residential, commercial, and electric power sector will offer a gradual lift to natural gas prices over the medium-term. We forecast 2024 average annual prices at $2.40/mmbtu and rising further to $3.10/mmbtu in 2025.
Beyond U.S. borders, LNG prospects look stable in the near-term. After a weak 2023, global gas demand is expected to pick up, helped by low prices and efforts by major importers to secure gas supply via long-term negotiated deals. Longer-term, a wave of LNG megaprojects could start bringing excess supply to markets in 2026 onwards.
Gold On Top of the Podium
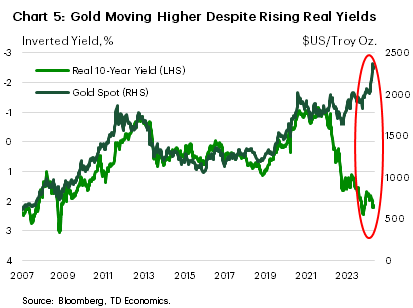
At around $2,350/oz, gold prices have pulled back slightly from their all-time highs recorded last month. Still, the yellow metal has outperformed most other commodities so far this year. Gold has surged despite the reduced prospects for interest rate cuts, especially in the U.S. where inflation has proved stubborn. Continuing U.S. economic outperformance has also spurred a renewed rally in the USD, which would historically drag down the non-interest-bearing asset. But in fact, Chart 5 shows that over the past 24-months, demand for gold has overpowered the historic correlation to USD and real yields movements.
Safe haven demand has strengthened as central bank buying of gold continues to accelerate as they look to diversify their portfolios amid concerns of ongoing geopolitical risk. All said, gold prices should remain strong as speculators continue to anticipate the start to the Fed cutting cycle. We are projecting nominal and real bond yields to head lower in the back half of the year, and coupled with strong demand, we’ve raised our gold forecast to $2,250/oz in 2024 with elevated levels expected to persist into 2025.
Silver prices, influenced by many of the same forces that drive bullion, should follow suit. Silver however is used as an input to more industrial uses and short-term fluctuations will be more closely tied to growth in global manufacturing, which has shown signs of recovery.
Industrial Metals: Positive Sentiment Shift and Ongoing Supply Worries
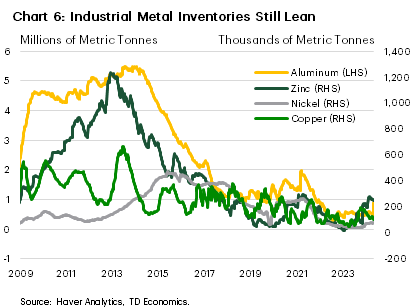
Industrial metals prices are catching a bid as demand proves resilient and supply concerns remain persistent. As it stands, the extended period of high global interest rates has not been as damaging to economic growth as had been assumed in consensus forecasts. Chart 6 also highlights the tight visible inventory levels across industrial metals, with only zinc showing evidence of an inventory build.
With China making up roughly half of the global demand for metals, it is no surprise that the industrial activity in the country will continue to be a key driver for metals markets this year. On this end, first-quarter Chinese growth surprised to the upside, with the outlook for the remainder of the year expected to be stable. A recently announced 1 trillion yuan in bond issue stimulus could help prop flagging sectors in China’s economy, boosting metals demand.
On top of this, newly imposed Western sanctions on Russian metal supplies may keep prospects for prices to the upside. As part of the sanctions, British and U.S. governments banned the delivery of new Russian supplies to the London Metals Exchange (LME) and Chicago Mercantile Exchange (CME). However, Russian product can still be produced and exported to other international warehouses. In this sense, we think these new sanctions will have some effect on prices via tighter supplies, but the upside from this channel would be limited. Russia accounts for roughly five percent of production across nickel, aluminum and copper markets.
Copper prices have embarked on a strong rebound so far this year, surging to record highs. The outlook for elevated prices largely reflects concerns around insufficient supply combined with bullish near and long-term demand. Alongside disruptions in South America, China’s top copper smelters jointly agreed to production cuts which could amount to a 5–10% reduction in Chinese supply. Given China’s status as the world’s top producer, copper markets stand to be undersupplied in the near-term. We’ve nudged our price projections higher to $4.30/lb by end of the year, with these levels expected to hold in 2025. Copper is becoming more far-reaching, extending beyond traditional industrial uses. Longer-term, copper will continue to play a big role in decarbonizing the economy as well as being used as in input to AI-fueled demand.
Aluminum prices recently broke out of their 12-month sideways trade range reaching the highest level in over a year. The move was mainly a result of the new supply concerns stemming from the US and UK ban on aluminum to select warehouses. Focus will shift to China, the global leader responsible for nearly 60% of the world’s production. China’s Yunnan province is nearing the end of its dry season, which typically stifles output due to the region’s reliance on hydropower. An increase in production for the remainder of the year will keep markets in a more balanced state.
Zinc is hovering near its one-year high, buoyed by the broader inflows from investment funds into the base metals sector as well as a surprising strong global growth performance to start 2024. Last year, European zinc smelters had curtailed production amid elevated power costs, a major contributor to inventory shortages. Now, smelter restarts are pulling production higher. Zinc inventories are growing at the fastest pace across industrial metals–though levels are still low–while markets are expected to push into a slight surplus in 2024. For now, Zinc prices appear to be shaking off the potential for oversupply and are instead focusing on positive trade data out of China suggesting domestic demand is improving.
The outlook for the nickel market is a bit more subdued. By most metrics, demand over the coming year should be healthy as the EV sector quickly becomes an important consumer alongside nickel’s input into clean energy technologies. However, new demand won’t be near enough to absorb the production wave, which could toss the supply-demand balance into the third consecutive annual surplus. Indonesia is playing a crucial role in the supply surge and is projected to account for more than 70% of global nickel supply over the next five years.
Lumber Prices To Slowly Recover, But Not Without Some Resistance
After a sharp decline in 2023, lumber prices were poised to embark on a healthy rebound this year. However, stubborn inflation stateside has pushed the prospects for interest rate relief to the tail-end of 2024, which is expected to delay any meaningful lumber price rally until next year. Lumber futures, currently trading at US$380/mbf, are roughly in line with pre-pandemic levels.
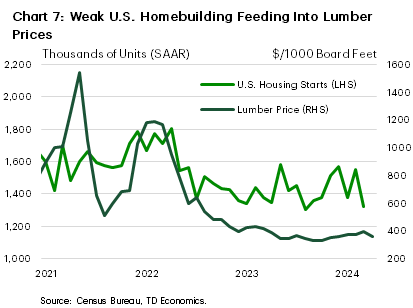
High interest rates are weighing on housing demand and have increased capital costs for developers, which has led to lackluster U.S. homebuilding activity (Chart 7). We do expect homebuilding in the U.S. to begin to recover next year, albeit at a modest pace, as housing affordability remains depressed. Additionally, the renovation boom that added to demand in recent years has likely run its course, limiting pressure from this channel. Sluggish demand has forced North American producers to curtail output, but even against this backdrop, any near-term upside in lumber prices will be limited as monetary policy remains meaningfully restrictive this year. All said, we project the price of benchmark Western SPF to register a gain in 2024 to US$425/mbf. For 2025, average prices should get a lift to US$460/mbf, reflecting a normalization in supply/demand conditions.
Agricultural Production Threats Have Re-Emerged
Wheat prices have moved up sharply to an 8-month high as weather events and geopolitical conflict have begun to stoke global supply concerns. Crops from top exporter, Russia, may be impacted by last summer’s abnormal warmth and, more recently, frosts. Meanwhile, overly dry conditions in Australia and soggy conditions in Brazil and Europe are putting more supply at risk. On the flip side, U.S. winter wheat conditions are improving. As of May 7, 28% of U.S. winter wheat, which is usually harvested in the summer, is in moderate or more intense drought, down from 48 % from the same period last year. North of the border, crop land in the Prairie provinces is still facing abnormally dry conditions. Despite this, output is expected to rebound by around 5% this year according to latest estimates. The United States and Canada are the 4th and 6th largest wheat producers globally, so improved North American supply helps, but it may not be able to counteract hampered production from other major global players. The latest WASDE report in May also calls for lower wheat supplies and reduced stocks for 2024/25, offering a tailwind for prices in the coming quarters. For now, we expect wheat prices to average $6.10/bushel in 2024 before moderating a touch to $6.00/bushel in 2025 (Chart 8).
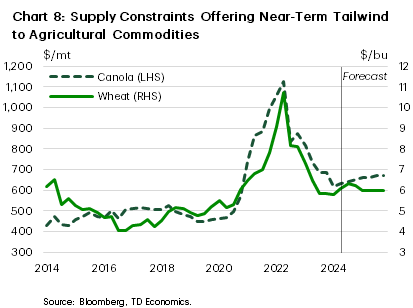
Canola, a staple commodity for Canadian farmers, has also joined in on the rally. Prices have rebounded to CAD$660/tonne mark from $570/tonne in February piggybacking on soybean’s recovery and benefitting various demand pressures. We think the prospects for higher prices in the near-term are more uncertain given the mixed global supply picture. Canadian producers have faced fierce competition from Australian farmers who have penetrated key export markets. As such exports of Canola this year are down by a considerable margin, but domestic and international demand for Canadian canola is ramping up. For example, Canada’s domestic crushing capacity will increase dramatically over the next two years due to investment and construction in new plants. Meanwhile record amounts of Canola oil are being used in feedstock in biofuel production.
Tight Supplies Expected to Boost Cattle and Hog Price
Cattle prices have resumed their upward ascent after pulling back in the fourth quarter of last year. At $178/cwt, prices are nearing record highs and are expected to stay elevated this year before moderating in 2025. The driving force behind higher prices is the low cattle inventory, which is poised to contract in 2024 for a second consecutive year. Beef production is also forecast to slip by 2% compared to 2023 according to the USDA’s most recent estimates. However, herd expansion in 2025 will lead to an easing in price conditions, where we expect cattle prices to ease to an average of $155/cwt.
Lean hog prices have railed in tandem, up an impressive 43% to around $100/cwt since the beginning of the year. Hogs prices are expected to stay elevated in 2024 as overall demand strengthens, supported by high retail prices for pork substitutes, like beef. Despite tight margins for pork producers in 2023, the outlook points to stronger hog production this year.


