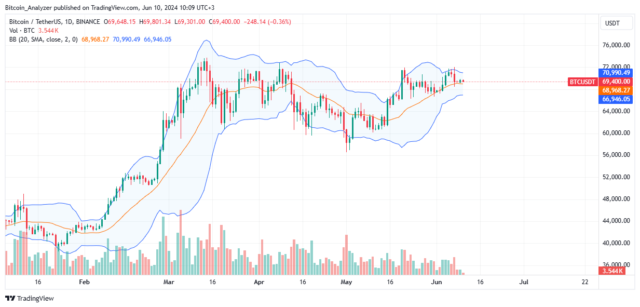
Bitcoin prices plunged on Friday last week, and there has been no change when writing. As at press time, the coin is moving horizontally, inside the bearish engulfing bar of June 6. However, there could be hope for optimistic buyers. The failure of sellers to press on over the weekend is a net positive. Even so, there should be a complete reversal of recent losses for trend continuation.
With Bitcoin down, there are concerns about the strength of buyers. So far, the coin is decent on the last day and week. Even so, the relatively low trading volume could suggest that traders are pulling out, even taking profit, in light of bulls collapsing below $72,000.

| Broker | Review | Regulators | Min Deposit | Website | |
|---|---|---|---|---|---|
| 🥇 |  |
Read Review | ASIC, FSA, CBI, BVI, FSCA, FRSA, CySEC, ISA, JFSA | USD 100 | Visit Broker >> |
| 🥈 |  |
Read Review | FMA, FSA | USD 50 | Visit Broker >> |
| 🥉 |  |
Read Review | FSCA, CySEC, DFSA, FSA, CMA | USD 0 | Visit Broker >> |
| 4 |  |
Read Review | CySEC, MISA, FSCA | USD 5 | Visit Broker >> |
| 5 |  |
Read Review | FCA, CySEC, FSCA, SCB | USD 100 | Visit Broker >> |
| 6 |  |
Read Review | FCA, FINMA, FSA, ASIC | USD 0 | Visit Broker >> |
| 7 |  |
Read Review | CySEC, FCA, FSA, FSCA, Labuan FSA | USD 100 | Visit Broker >> |
| 8 |  |
Read Review | CBCS, CySEC, FCA, FSA, FSC, FSCA, CMA | USD 10 | Visit Broker >> |
| 9 |  |
Read Review | ASIC, CySEC, FSCA, CMA | USD 100 | Visit Broker >> |
| 10 |  |
Read Review | IFSC, FSCA, ASIC, CySEC | USD 1 | Visit Broker >> |
Nonetheless, the following Bitcoin news events could help revive demand, perhaps lifting the coin higher:
- Besides public companies like MicroStrategy and Tesla, which hold a large amount of coins, all spot BTC ETFs hold over 1.031 million BTC. The accumulation will only continue rising, meaning scarcity will increase as adoption increases.
- Amid the wild accumulation, on-chain data now shows that hedge funds are shorting BTC despite the rising interest from institutions and the masses. CFTC CME data shows that their bearish stance on the coin has been increasing even as prices rally toward all-time highs.
Bitcoin Price Analysis
BTC/USD is down, looking at the performance in the daily chart.
The collapse of Bitcoin was with a slightly high trading volume, pointing to trader participation.
With BTC finding resistance once more at $72,000 and the bearish engulfing bar printing, aggressive traders might look to short, targeting $66,000.
Any dip below $66,000 will unwind all gains of May 20, signaling a trend shift, favoring sellers.
Conversely, an unexpected sharp spike above $72,000 could trigger a welcomed leg up to $74,000 or higher.


