

This farmdoc daily is the latest (January 16, 23, and 30 and February 6)) to explore the 2024 commodity program decision. A price ratio is discussed that has been a useful indicator if ARC-CO (Agriculture Risk Coverage – county version) or PLC (Price Loss Coverage) will have the higher US average payment per base acre (see farmdoc daily, December 9, 2021 and February 20, 2023). The perspectives that underpin this price ratio are to focus on assessing whether or not PLC will make a payment and, if no PLC payment is expected, to favor ARC-CO since it can make payments for low yields. As of December 2023, the price ratio suggests PLC is unlikely to make payments except for peanuts and seed cotton. Recent market price weakness however adds nuances to the 2024 commodity program decision.
Decision Perspective
2024 commodity program options are ARC-CO, PLC, and ARC-IC, a farm version of ARC. Key features of these three options are briefly discussed in Data Note 1. The most common decision is ARC-CO vs. PLC. Different perspectives can be used to assess this decision.
Two perspectives underpin the use of the Dec. Cash – ERP decision indicator.
The first is that, if PLC is likely to make a payment, it is the program to select since it is likely to pay more per base acre in this situation. Thus, the first program decision step is to assess whether or not PLC is expected to make a payment. PLC makes payments only if the US market year price is less than the effective reference price for the year. The US December cash price is used as an indicator of next market year’s US price. The lower is the ratio of the US December cash price to the effective reference price, the more likely is PLC to make payments.
The second perspective is that ARC-CO is favored if it unlikely that PLC will make a payment. ARC-CO will likely pay more per base acre in this situation because, unlike PLC, ARC-CO can pay if county yield is below trend.
2024 Decision Indicator
The 2024 commodity program decision indicator is the ratio of the December 2023 US cash price to the 2024 crop year effective reference price (hereafter, Dec. cash – ERP ratio). Among the 18 program commodities for which the ratio can be calculated (see Data Note 2), the price ratio decision indicator ranges from 91% for peanuts to 223% for small chickpeas (see Figure 1). For corn, soybeans, and wheat; the ratio is 120%, 141%, and 123%, respectively.
The December 2023 US cash prices are obtained from the January 2024 Agricultural Prices report released at the end of January 2024. The source for the 2024 effective reference prices is the US Department of Agriculture, Farm Service Agency (USDA, FSA).
Historical PLC Payment Probability
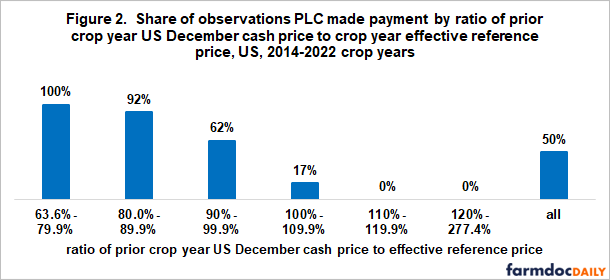
When the Dec. Cash – ERP ratio was below 90% for the 2014-2022 crop years when PLC was a program option and for which payment data are complete, PLC almost always made a payment (see Figure 2). In contrast, when the ratio was greater than 110%, PLC made no payment. Overall, PLC made a payment in 50% of the 158 crop-year observations between 2014 and 2022.
Average PLC vs. ARC-CO Payment per Base Acre
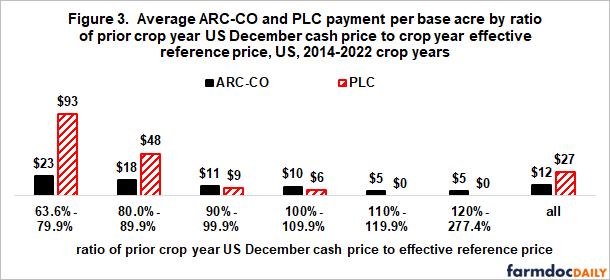
When the Dec. Cash – ERP ratio was less than 90%, average payment per base acre was notably higher for PLC than ARC-CO over the 2014-2022 crop years (see Figure 3). When the ratio was greater than 90%, ARC-CO had the higher average US payment by $2 to $5 per base acre.
The difference in average payment can understate the risk management value of ARC-CO when market year price exceeds the effective reference price. For example, for the 2022 crop year, corn’s market year average price was $6.54, or 77% higher than its $3.70 effective reference price. PLC made no payment while ARC-CO payment averaged $2.47 per corn base acre. However, due to low yields ARC-CO’s payment exceeded $25 per base acre for 5.2% of the counties with a corn program base, a potentially meaningful contribution to managing risk in 2022 for farms in these counties.
Discussion
The ratio of the US December cash price to the effective reference price for the upcoming crop year has been a useful predictor of whether ARC-CO or PLC will have the higher average US payment per base acre, especially when the ratio has been below 90% or above 110%.
The Dec Cash – ERP ratio for the 2024 crop decision is above 110% for all of the program commodities for which this ratio can be calculated except for seed cotton and especially peanuts.
Given historical performance, the Dec. Cash – ERP indicator for the 2024 commodity program decision suggests that ARC-CO will likely have the higher average US payment per base acre except for peanuts and seed cotton. Historical performance also suggests that the difference in average payment per base acre is likely to be relatively small except maybe for peanuts.
All prediction indicators can be wrong since history is not a perfect predictor of the future. Moreover, all prediction indicators are simplified versions of the real world. It is therefore important to assess historical decision indicators within the contexts in which they are being used.
Two perspectives underpin the Dec. Cash – ERP decision indicator. The first is that, if PLC is likely to make a payment, it is the program to select because it is likely to pay more per base acre in this situation. Thus, the first program decision step is to assess whether or not PLC is expected to make a payment. The second perspective is that ARC-CO is favored if the expectation is that PLC is unlikely to make a payment. The reason for choosing ARC-CO in this situation is that, unlike PLC, ARC-CO can pay if county yield is below trend.
The 2024 decision is also being framed by the downward weakness in US cash prices so far during the 2023 crop marketing year. This weakness suggests two additional considerations in making the 2024 commodity program decision.
One is to wait and see what US cash prices do during February and early March 2024. I am hesitant to recommend this strategy. It bunches up FSA workloads at the March 15 decision deadline, but it may provide insight this year.
The second is to consider splitting the decision across FSA farms if multiple FSA farms exist. For a given program commodity, choose ARC-CO for some FSA farms; PLC for other FSA farms. This diversified approach provides some potential protection against both low 2024 prices and low 2024 yields. Diversification is always a management strategy when uncertain decisions are being made, especially if the degree of uncertainty is larger than normal.
Data Note 1
ARC-CO provides transition assistance when county revenue declines from multiple years of high revenue to a revenue that is less than 86% of the county’s benchmark market revenue for 5 recent crop years. PLC provides assistance for low prices, where low is less than 100% of an effective reference price (ERP) defined by Congress. ARC-IC provides assistance when average per acre revenue from all program crops planted on an ARC-IC farm unit is less than 86% of its per acre benchmark revenue. ARC-CO benchmark revenue is calculated using Olympic averages (high and low values removed) of US market year cash price and trend-adjusted county yields over five recent market years. The 2024 ERP is a floor on ARC price for the 2024 calculation. PLC payment yield is a farm’s average yield over a more distant historical period. ARC-CO, PLC, and ARC-IC pay on 85%, 85%, and 65% of base acres, respectively. ARC payment is capped at 10% of benchmark revenue. PLC payment rate per unit is capped at (ERP minus loan rate). The October 29, 2019 farmdoc daily discusses when ARC-IC is an option to consider.
Data Note 2
A US December cash price is not reported for crambe, mustard, rapeseed, safflower, and sesame. The price used for temperate Japonica rice is the medium-short grain rice price for California. Almost all US Japonica rice is grown in California. The price used for medium-short grain rice is the average for this rice is all states other than California.
References and Data Sources
Paulson, N., G. Schnitkey, C. Zulauf, J. Coppess, and J. Baltz. Considering Low Prices, Yields, and Maximum ARC-CO Payments for 2024. farmdoc daily (14):20 Department of Agricultural and Consumer Economics, University of Illinois at Urbana-Champaign. January 30, 2024. http://www.farmdoc.illinois.edu/
Paulson, N., G. Schnitkey, R. Batts, and C. Zulauf. First Look at PLC and ARC-CO for 2024. farmdoc daily (14):11. Department of Agricultural and Consumer Economics, University of Illinois at Urbana-Champaign. January 16, 2024. http://www.farmdoc.illinois.edu/
Paulson, N., C. Zulauf, J. Coppess, and G. Schnitkey. Comparing 2024 Effective Reference and ARC Benchmark Prices. farmdoc daily (14):15 Department of Agricultural and Consumer Economics, University of Illinois at Urbana-Champaign. January 23, 2024. http://www.farmdoc.illinois.edu/
Paulson, N., C. Zulauf, G. Schnitkey, and J. Coppess. County Yield Variability and ARC-CO. farmdoc daily (14):25 Department of Agricultural and Consumer Economics, University of Illinois at Urbana-Champaign. February 6, 2024. http://www.farmdoc.illinois.edu/
US Department of Agriculture, Farm Service Agency. ARC/PLC program. January 2024. https://sandbox.fsa.usda.gov/programs-and-services/arcplc_program/index
US Department of Agriculture, National Agricultural Statistical Service. Agricultural Prices. ISSN: 1937-4216. January 31, 2024. https://usda.library.cornell.edu/concern/publications/c821gj76b
Zulauf, C., B. Brown, G. Schnitkey, K. Swanson, J. Coppess, and N. Paulson. The Case for Looking at the ARC-IC (ARC-Individual) Program Option. farmdoc daily (9): 203. October 29, 2019. Department of Agricultural and Consumer Economics, University of Illinois at Urbana-Champaign. http://www.farmdoc.illinois.edu/


 FIRST QUARTER RESULTS IMPACTED BY LOWER COMMODITY SALES")