

Once crude oil prices cross above $85 per barrel, Treasury yields become more sensitive to energy
- U.S. Treasury notes and bonds are struggling near yearly lows as bonds and crude oil prices have hit fresh yearly highs.
- Interest rate cut odds for 2024 are dropping, with the odds of a 25-basis-point reduction in June are down to 61.7% from 63.7% a week ago.
- Bond volatility has expanded but remains relatively low.
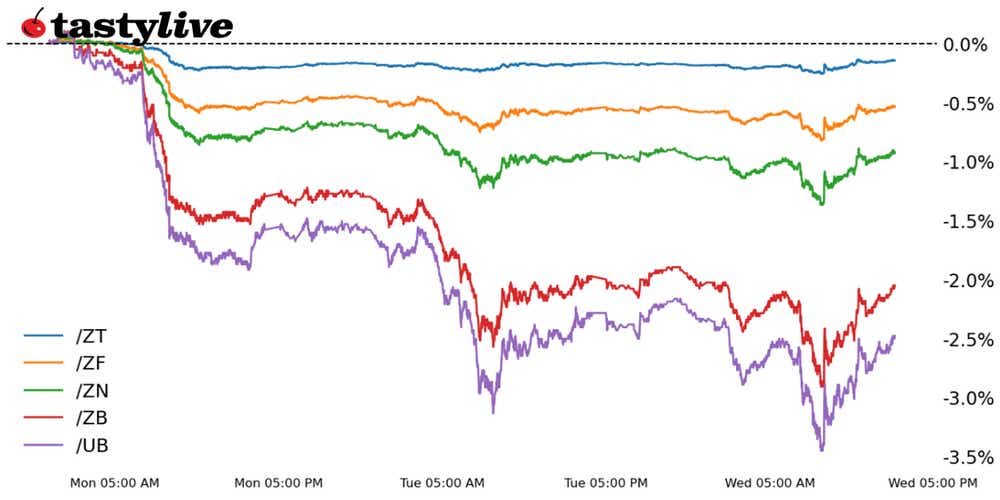
Market update: U.S. 10-year yield down to 4.355%
For much of 2024, the U.S. equity market rally has defied skeptics who were watching commodity prices and bond markets. Falling rate cut odds in the face of a burgeoning AI narrative and a resilient U.S. economy mattered little for bulls.
But funny things tend to happen in markets once crude oil prices cross above $85 per barrel. U.S. Treasury yields become more sensitive to energy, as pass-through effects that feed into inflation expectations are embedded in the long-end of the yield curve.
Recent months have seen rising yields not as a problem because they were rising for a good reason—the economy was better than expected! Now, they may be rising for a bad reason—inflation hasn’t been defeated in a timely manner and may be ready for a second wave.
Price action suggests the Goldilocks immaculate disinflation narrative that’s guided markets higher in recent months is at a crucial fork in the road. Look no farther than what’s happening between energy markets and bond markets:
Crude Oil (/CL) vs. 30s (/ZB): Daily Chart (June 2023 to April 2024)
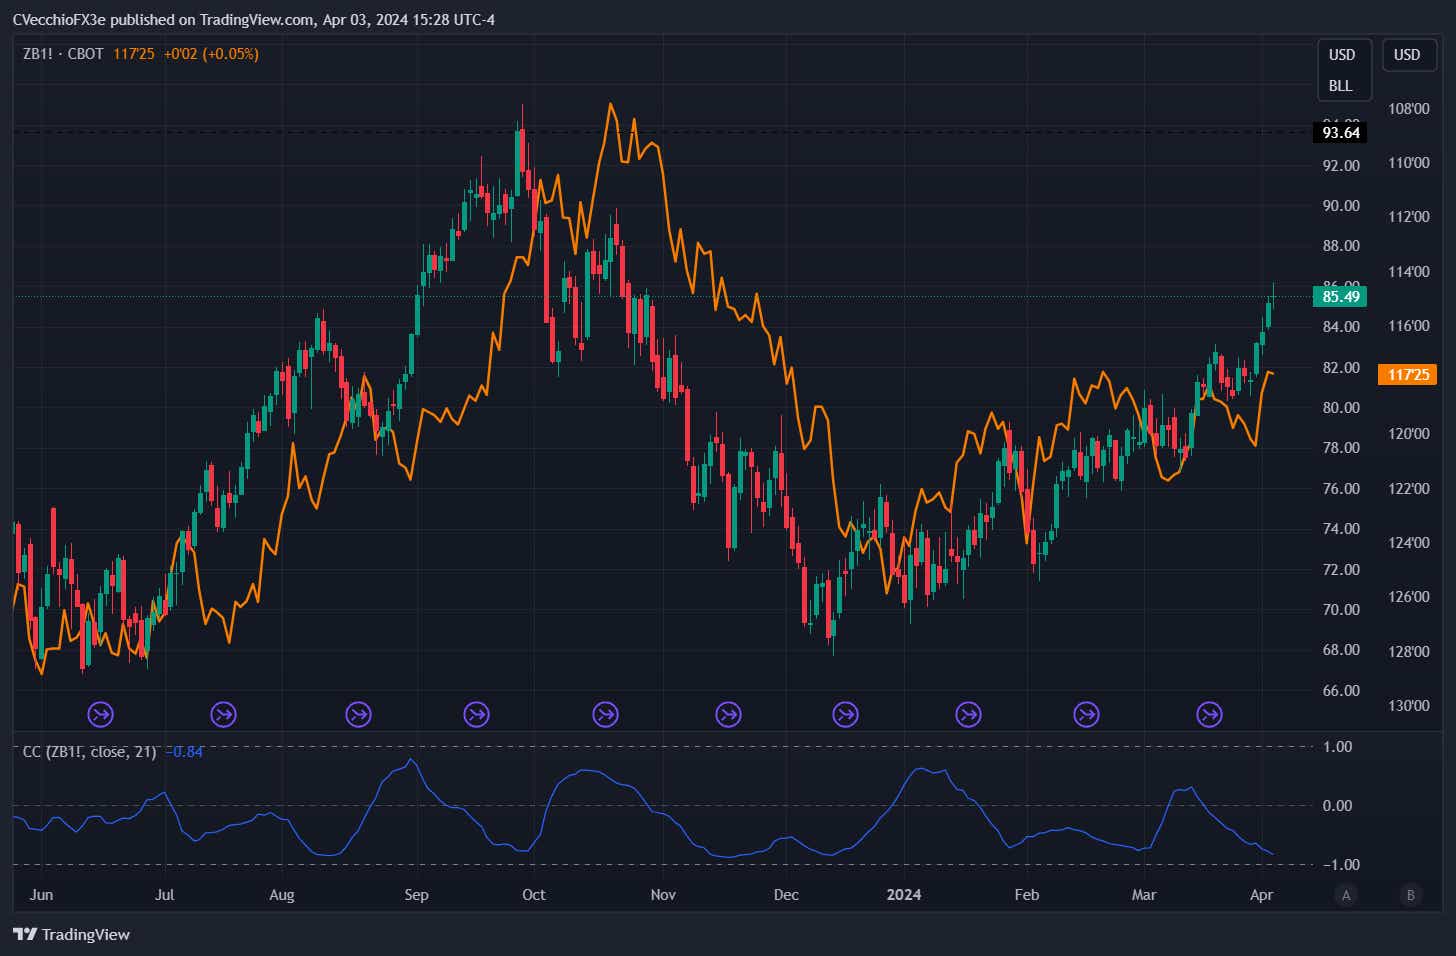
Crude oil prices ($/CL – candlesticks) tend to lead 30s ($/ZB—orange line, inverted), and they’re currently sitting at yearly highs. The rolling one-month correlation between /CLK4 and /ZBM4 has become increasingly negative in recent days, now sitting at -0.84. Similarly, /ZBM4 sees a rolling one-month correlation of -0.88 with DBC, the Deutsche Bank Commodity Index Tracking Fund.
One of the knock-on effects of the rise in commodity prices has been the elimination of rate cuts over the course of 2024.
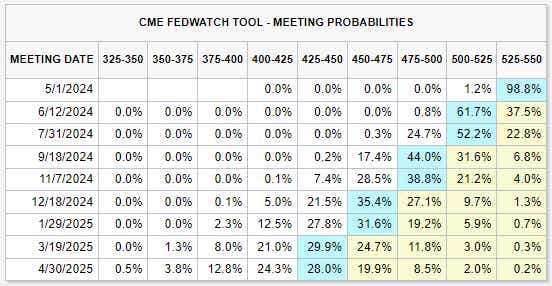
While not a problem for U.S. equity markets thus far, narratives can flip like a light switch: The perception of fewer cuts because of inflation, instead of a resilient U.S. economy, could prove to be an albatross around markets’ collective necks.
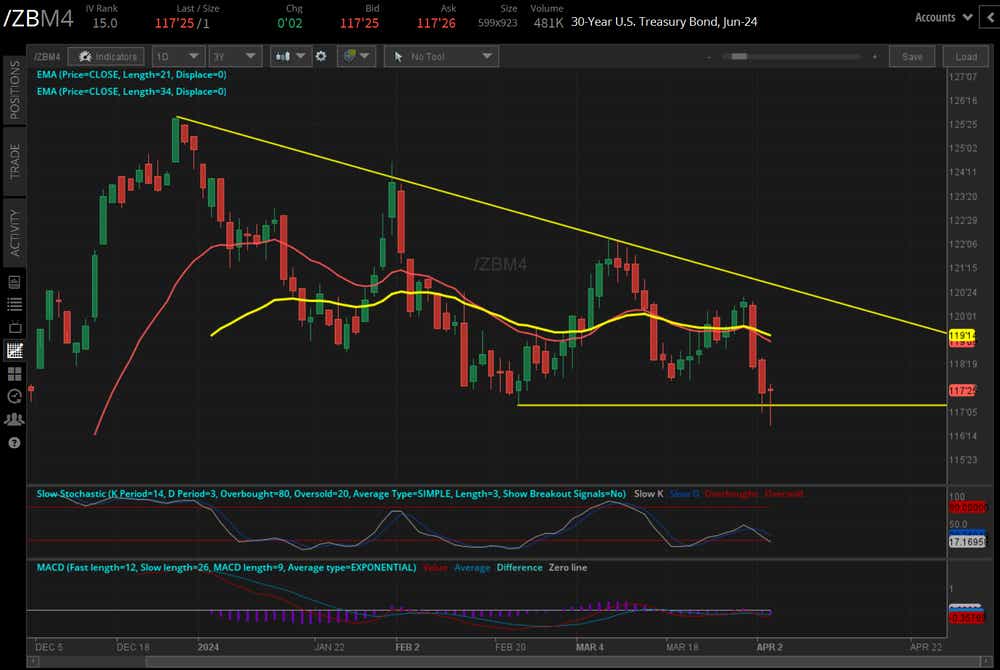
Against this backdrop, 30s (/ZBM4) finds itself sitting at range support. The implications are clear: If /CLK4 continues to rally, it stands to reason that /ZBM4 will likely break lower from here. And if it does, a further reduction in June rate cut odds below 50% could become too difficult for U.S. equity market bulls to ignore.
/ZB US 30-year Bond Price Technical Analysis: Daily Chart (October 2023 to April 2024)
Christopher Vecchio, CFA, tastylive’s head of futures and forex, has been trading for nearly 20 years. He has consulted with multinational firms on FX hedging and lectured at Duke Law School on FX derivatives. Vecchio searches for high-convexity opportunities at the crossroads of macroeconomics and global politics. He hosts Futures Power Hour Monday-Friday and Let Me Explain on Tuesdays, and co-hosts Overtime, Monday-Thursday. @cvecchiofx
For live daily programming, market news and commentary, visit tastylive or the YouTube channels tastylive (for options traders), and tastyliveTrending for stocks, futures, forex & macro.
Trade with a better broker, open a tastytrade account today. tastylive, Inc. and tastytrade, Inc. are separate but affiliated companies.


