
")
jetcityimage
Investment Thesis
I do not consider Bunge Global SA (NYSE:BG) to represent an investment opportunity, as the share value of Bunge follows the same trend as the prices of the main agricultural commodities. Corn, soybean, and wheat display relatively high prices, and the existing oversupply exerts downward pressure on prices. Additionally, Bunge is not a company that demonstrates levels of efficiency and profitability superior to similar companies that will indicate exceptional growth.
Bunge
I want to start this analysis by showing the relationship between Bunge’s stock price and the soybean (S_1:COM), corn (C_1:COM), and wheat (W_1:COM) prices; they all move in the same direction. Therefore, Bunge’s sales and incomes follow the cyclical component of the agricultural commodity prices.
Seeking Alpha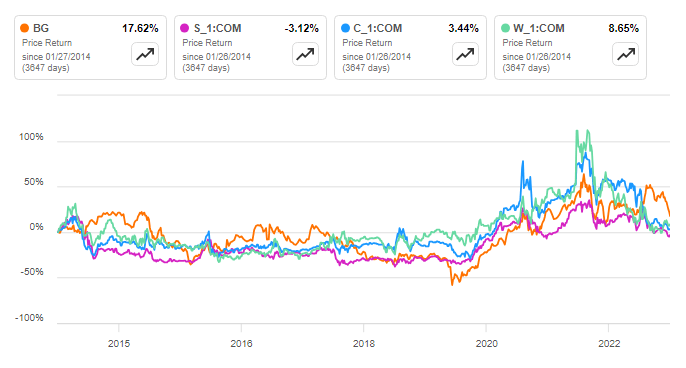
Before moving to other topics, explaining Bunge’s business model is convenient. Bunge buys agricultural commodities such as soybean, corn, wheat, sunflower, rapeseed, etc., from farmers and intermediaries. With these commodities, the company does two things: the first is to do the merchandising activity, which means reselling them, and the second activity is processing, which consists of transforming them. An example of processing is transforming soybean into soybean oil and soybean meal. Both activities belong to the agribusiness segment that moved 18,854 metric tons during September-June 2023.
Filings
The other two segments are Refined and Specialty Oils and Milling; Bunge buys part of its processing production and sells these tons to other companies. For example, the company buys wheat from farmers to process it into wheat flour (milling), and subsequently, Bunge sells this refined product with its brand.
An important point to highlight is the scarce transformation between Bunge’s input and output; for example, merchandising consists of buying and reselling commodities, so the input purchasing price and the selling price will have a high correlation because they are the same product. On the other side, you can consider a company that produces cars, where there is a substantial difference between the output (a new car) and the steel price. With the previous explanation, I want to point out the strong relationship between the agricultural commodity prices and the Bunge price per share.
Corn, Soybean, and Wheat World Supply and Demand
Given the strong relationship between Bunge’s stock price and the primary agricultural commodities, a World Supply and Demand analysis must be carried out to identify the trends of corn, soybean, and wheat; these are the primary commodities that Bunge trades. Before moving on, the reader should know that 00/01 corresponds to the year 2000/2001; in the United States, the agricultural calendar starts in September and ends in August of the following year.
I want to start with the period between 12/13 (market calendar 2012-2013) and 17/18, in which the world corn production stayed over the domestic consumption, indicating an oversupply. That period coincides with low average corn prices, as observed in the chart. Again, from 2021 to 2023, the production surpassed the domestic consumption in 21/22 and 23/24, and it was slightly lower in 22/23; in this period, there was a decline in the annual average corn price per bushel as a consequence of the oversupply.
Image was created by the author with data from the United States Department of Agriculture and macrotrends.net
The second commodity to analyze, soybean, has seen a higher world production than the world domestic consumption in ten years over the last fourteen years, explaining why it is the commodity with the worst price performance in the chart from the first section. From 19/20 to 21/22, there were two years with soybean world domestic consumption higher than the soybean world production, causing higher average prices. Subsequently, from 2021/22 to the present, world soybean production has been higher than domestic consumption, causing a slow decline in soybean prices per bushels.
Image was created by the author with data from the United States Department of Agriculture and macrotrends.net
The last commodity to analyze, wheat, shows an oversupply from 13/14 to 20/21, which caused low wheat prices. Then, in 21/22 and 22/21, the world’s wheat domestic consumption was higher than the world’s wheat production, causing an increase in wheat prices. Since then, wheat prices have decreased due to the war in Ukraine, a wheat producer, and the tight commodity supply environment.
In my view, the analysis from this section indicates that the corn, soybean, and wheat prices are decreasing due to oversupply. This scenario is a negative signal for Bunge’s price per share because it will reduce Bunge’s financial performance through lower sales and profit levels.
Bunge Production
This section will analyze how higher commodity prices have affected Bunge’s financial statements. You will see that in the years with higher agricultural commodity prices, Bunge has obtained higher profitability.
Bunge segments its activities into two categories: core segment and non-core segment. The core segment includes Agribusiness, Milling, and Refined and Specialty Oils, while the non-core segment includes sugar and bioenergy. This section delves into the core segment because it represents more than 99% of Bunge’s net sales.
Agribusiness
Image was created by the author with data from Bunge’s filings
The agribusiness segment, the primary Bunge source of revenues and income, showed a 5.9% total increase during 2015-2021; at the beginning of the period, the production was 134,136,000 metric tons, and the last year was 142,013,000 metric tons.
From 2021 to September 2023, agricultural commodities saw a price increase, which led to Bunge’s impulsive net sales and EBIT. In 2020, the net sales were around $30,000 million; in 2021, they overpassed $40,000 million, generating higher EBIT levels; the company manifested two reasons for higher EBIT margin: higher price levels and the production increase.
Refined and Specialty Oils
The Refined and Specialty Oils Segment is where Bunge has grown the most, with an increase of 30.2% in its traded tons during 2015-2023Q3. In 2015, the number of metric tons was 6,831 thousand, and in 2022, it arrived at 8,896 thousand metric tons, while in the same period, the net sales jumped from $6,698 million to $15,217 million, positively affecting the EBIT margin. Again, the company manifested that higher oilseed prices and production levels during 2021-2023 were the reason for having higher EBITDA margins.
Image was created by the author with data from Bunge’s filings
Milling
The milling segment shows a decline in the commercialized tons between 2022Q3 and 2023Q3, equivalent to a minus 22.7% due to the sales of the Mexican wheat milling business in 2023. In 2021, Bunge made a non-recurring impairment charge of $170 million, causing a minus $74 million EBIT loss. Again, in 2022, the net sales increased due to higher commodity prices.
Image was created by the author with data from Bunge’s filings
Bunge’s core segment shows the same pattern: High sales levels during 2021-2023Q3 but a decline in 2023Q3 TTM. As observed in the other sections, these higher net sales are due to higher commodity prices.
Financial Analysis
Another perspective is to analyze whether Bunge is performing better than its competitors or not because if the company shows superior financial metrics, the investor will be willing to pay a premium for Bunge, causing a higher price per share.
source: seekingalpha.com
Bunge shows price-to-earning and price-to-book values in line with its peers; only the price-to-cash flow is considerably higher than the values from Wilmar (OTCPK:WLMIF) and Glencore (OTCPK:GLCNF). The company shows three-year and five-year revenue metrics aligned with its peers; my only concern is the low Bunge’s EBITDA margin. The company excels in ROE and asset turnover metrics, indicating the efficiency to generate high sales levels, incrementing the return on equity indicator.
I believe Bunge does not exhibit astonishing results compared to its peers and does not dominate the key financial metrics. I would like to see a company with a lower debt-to-equity ratio, a five-year revenue growth rate of at least 15%, and a higher return on equity.
What to Expect for Q4 Report 2023
As I commented in the previous section, Bunge’s activity follows the agricultural commodity cycles. Based on the history, the last quarter of the year (Q4) has shown lower net income values than other quarters, so the first conclusion is that the net income for 2023Q3 will be lower than its previous quarter.
Image was created by the author with data from Bunge’s filings
A second question is how much the net sales decline will be; the answer will depend on the decrease in agricultural commodity prices in 2023Q4 and how those magnitudes in that quarter were in previous years. The average price per bushel for soybeans during the last quarter of 2024 is comparatively higher than the values observed in 2021Q4. However, the average prices per bushel for corn and wheat were lower in 2023Q4 than the values observed in 2022Q4 and 2021Q4.
Image was created by the author with data from macrotrends.net
Based on the analysis presented in the previous paragraph, I think Bunge’s net sales for 2023Q4 will be similar to the value observed in 2021, which was $232 million; it will imply a net income of around $1,909 million in 2023.
Risk
So far, I have concentrated the analysis on Bunge without considering the possible acquisition of Viterra Limited. In October 2023, Bunge’s shareholders approved the merger, and mid-2024 is the expected date to close the deal. The merger will add handling capacity in grain and softseed and expand operations where Bunge is underrepresented.
I want to compare both companies’ revenues and income before taxes to put the size of the merger in context. In 2022, Viterra’s revenues and income before taxes were $53,854 million and $1,356 million, respectively, while for the same year, Bunge’s revenues and income before taxes were $67,232 million and $2,066 million, respectively.
Assessing the potential increase or decrease in Bunge’s price per share is essential. If the oversupply of agricultural commodities continues for several years, it will push Bunge’s stock price down; during 2012-2018, a period of oversupply, Bunge’s stock price fluctuated around $70; this value will be a rough estimation of a potential drop in Bunge’s price per share; an estimation based in the chart. On the other hand, if there is an unexpected event that will increase agricultural commodity prices, as they did during 2021-2022. In this case, Bunge’s share price could go up to $120, which represents a $30 increase, an optimistic scenario. Finally, prices can remain flat, with Bunge’s share price being within the range of $80 to $100 per share in the coming years.
TradingView
Conclusion
The first section showed how connected Bunge’s price per share followed the same direction with the soybean, corn, and wheat prices. Then, the analysis investigated whether there is an oversupply scenario, concluding that world production is higher than domestic consumption, causing a decline in corn, soybean, and wheat prices. Subsequently, an analysis of the Bunge core segments demonstrated how the company registered high net sales and EBIT values in the last three years due to high commodity prices.
The three sections mentioned in the previous paragraph have the same factor: higher commodity prices, which reflect the cyclical relationship.
The last section looked for a distinctive characteristic between Bunge and its peers that will be an incentive for paying a premium. The financial metrics did not show considerably higher results than its peers.
Based on the analysis presented in this article, I consider liquidating any position in Bunge because commodities are cyclical; high prices follow low prices, and low prices follow high prices. Additionally, Bunge’s financial performance is not exceptional compared to its peers; in a crucial metric like the ROE, Bunge is not the company with the highest value, suggesting it will not have the capacity to increase capital expenditure and growth at high rates in the upcoming years.
Editor’s Note: This article discusses one or more securities that do not trade on a major U.S. exchange. Please be aware of the risks associated with these stocks.


