On inflation
I like this quote-
“Goods deflation likely transitory as downward pressure on goods demand and input costs are fading. 1H24 global core inflation likely to settle near 3%, which won’t resolve the immaculate disinflation debate.”
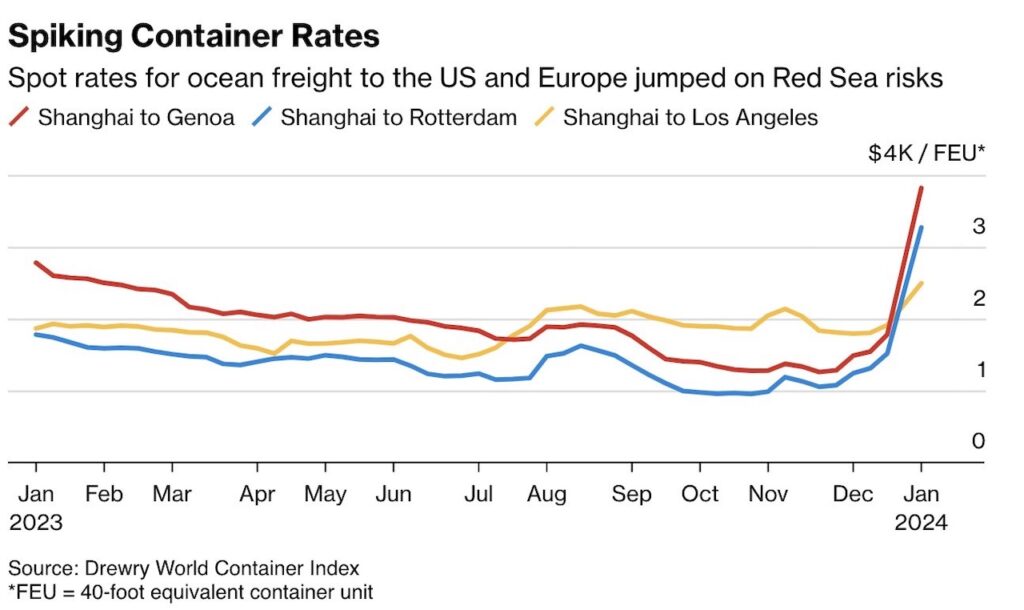
And this quote does not include the steep rise in shipping costs of late.

Note the move in costs as of early December was at yearly lows.
One month later, the costs are at yearly highs.
Super cycles don’t just fade away-they cycle-with volatility and passion just like the word super suggests.
40% up or down price moves in commodity related instruments is not unusual and very much like we saw in the 1970s.
Commodities will flatline when inflation is over, just like they did for so years before 2020, We do not expect that to happen until mid-2025 to early 2026.
The issues for sticky inflation:
It’s global,
Still shortages of basic raw materials,
Demand not as weak as folks thought,
Geopolitics,
Weather concerns,
FED might not lower rates, but they won’t raise them either. Furthermore, so far, many commodities are not concerned with the dollar or rates-any misstep by the Fed can send commodity pricing soaring,
Recent job and ISM reports are deceptive- There were significant drops in employment and new orders, while prices paid remain quite elevated showing that inflation remains sticky. Wages rose in December and are now back over 4%. Part of the strong labor numbers posted Friday is because the government hiring went up 5.2% this year.
Disclaimer: There are no guarantees and of course, our Year of the Dragon might avoid any trips to Hell. But in case:
How will we know when inflation returns?
Dollar does something more dramatic.
Silver starts to outperform gold.
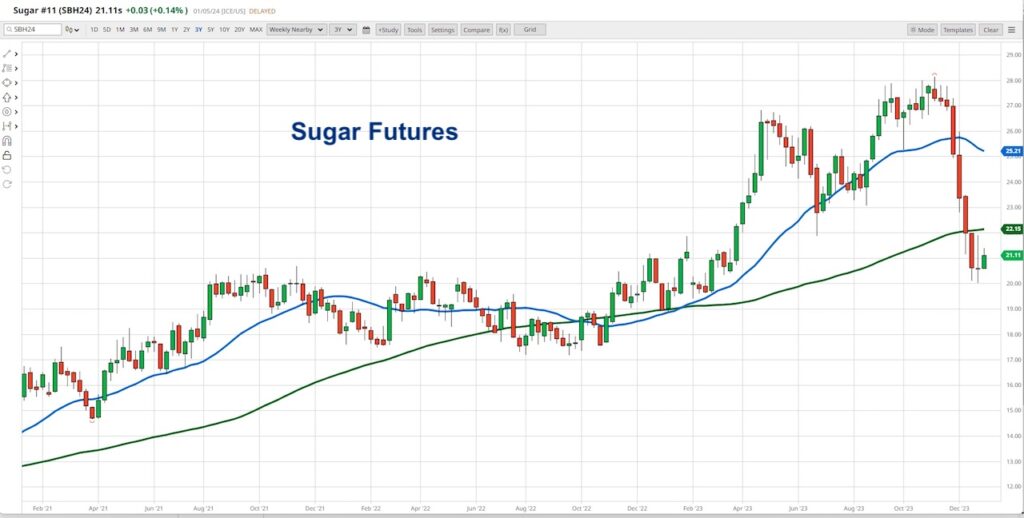
Sugar (perfect example of a super cycle type volatility) heads back over 22 cents
We expect the next wave to occur in late spring/summer 2024.
Looking at the sugar chart of the March contract, in March 2021 sugar traded at $.15.5 a pound. (In 2020 the prices was $.06 a pound.
Since then, sugar spent most of late 2021 and most of 2022 consolidating. Then in February 2023, it took off finally peaking at $.28 in November 2023.
That dramatic drop is exactly my point. This is what happened in the mid to late 1970s.
Sugar is still 4 times higher in price than in 2020.
Should we see this return over the 200-daily moving average (green line) or over $.22, I would think that my favorite barometer is telling us something-at least something about becoming too complacent in a world full of powder kegs.
Twitter: @marketminute
The author may have a position in mentioned securities at the time of publication. Any opinions expressed herein are solely those of the author and do not represent the views or opinions of any other person or entity.


