
")
asbe
The composite of 29 primary commodities traded on U.S. and U.K. exchanges moved 3.91% lower in Q4 2023. At the end of 2023, the asset class was 4.52% lower. Commodities were 5.37% higher in 2022 and 26.79% higher in 2021. In 2020, the asset class moved 9.89% higher.
Rising interest rates throughout most of the year weighed on raw material prices. Moreover, after significant gains over the past few years, the commodities asset class experienced price consolidation in 2023, with four of the six sectors posting declines.
As we head into 2024, the prospects for lower interest rates could favor gains in the commodities asset class. Moreover, geopolitical turmoil impacting trade and logistical routes could cause sudden price volatility. The Invesco DB Commodity Index Tracking Fund ETF (NYSEARCA:DBC) moved higher and lower with raw material prices, with a concentration on the energy sector, the worst-performing sector in the asset class in 2023.
Soft commodities led on the upside: Animal proteins post a slight gain
The soft commodities sector, including world sugar, Arabica coffee, cocoa, cotton, and frozen concentrated orange juice futures, rose 24.04% in 2023. Softs were the best-performing sector of the commodities asset class for the year ending on Dec. 29, 2023. Cocoa led the sector, while FCOJ won the silver metal. Arabica coffee futures posted a double-digit percentage gain, while sugar futures edged higher. Cotton was the only soft commodity posting a decline in 2023. Over the past two years, sugar, coffee, cocoa, and cotton futures reached the highest prices since at least 2011. FCOJ futures rose to new record highs in 2023.
Animal proteins, including live and feeder cattle futures, edged 1.74% higher in 2023. Feeder cattle led the way on the upside with an over 21% gain, while the live cattle were up around 6.7%. Lean hog futures went the other way, falling nearly 22.5%.
Softs and meats were the only two sectors that posted gains in 2023.
Energy suffered the most significant loss – Metals and grains declined
The traditional energy sector, including crude oil, oil products, natural gas, and ethanol, fell 21.85% in 2023. Natural gas was the worst-performing commodity, posting a decline of over 43%. Oil, oil products, and ethanol posted double-digit percentage losses. Meanwhile, coal for delivery in Rotterdam, The Netherlands, was more than 43% lower in 2023. The grain sector, including soybeans, corn, CBOT wheat, oats, and rice, dropped 13.04%, with only oats posting a marginal gain.
Base metals traded on the London Metals Exchange fell 10.03%. While copper, tin, and aluminum prices edged higher, zinc and lead were on either side of 10% lower, and nickel led the sector on the downside with a 44.75% loss.
Precious metals fell 8% for the year ending in December 2023. Gold was more than 13.4% higher, and silver moved only marginally higher. Platinum prices fell, while palladium futures plunged, falling over 38%.
Winners in commodities in 2023
In 2023, 15 commodities moved to the upside, with seven posting double-digit percentage gains.
Chart of the most liquid commodities posting gains in 2023 (Hecht Commodity Report Database)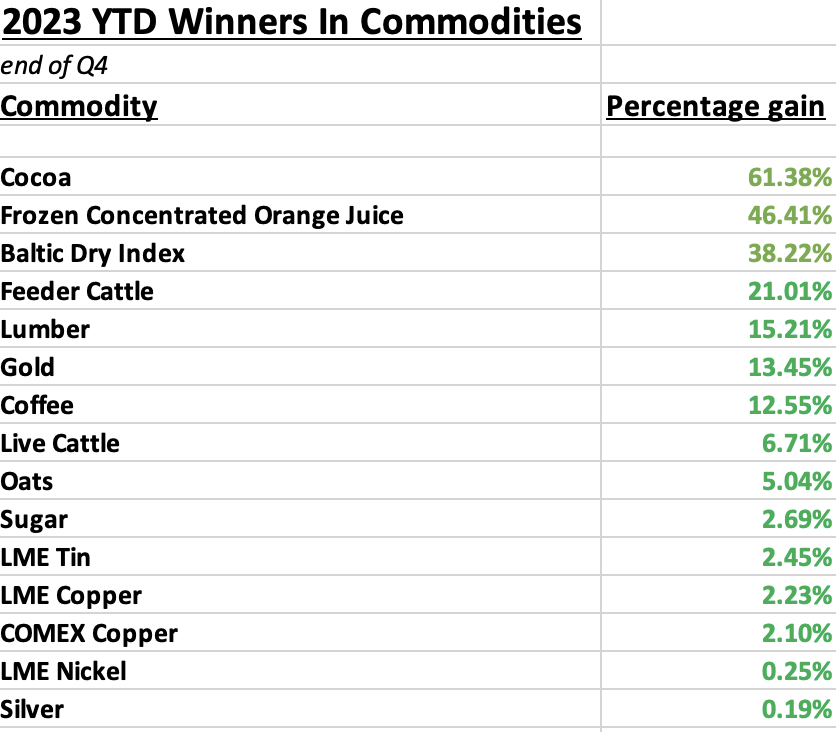
Losers in commodities in 2023
Twenty-five commodities posted losses in 2023. There were 21 double-digit percentage losers over the period:
Chart of the most liquid commodities posting losses in 2023 (Hecht Commodity Report Database)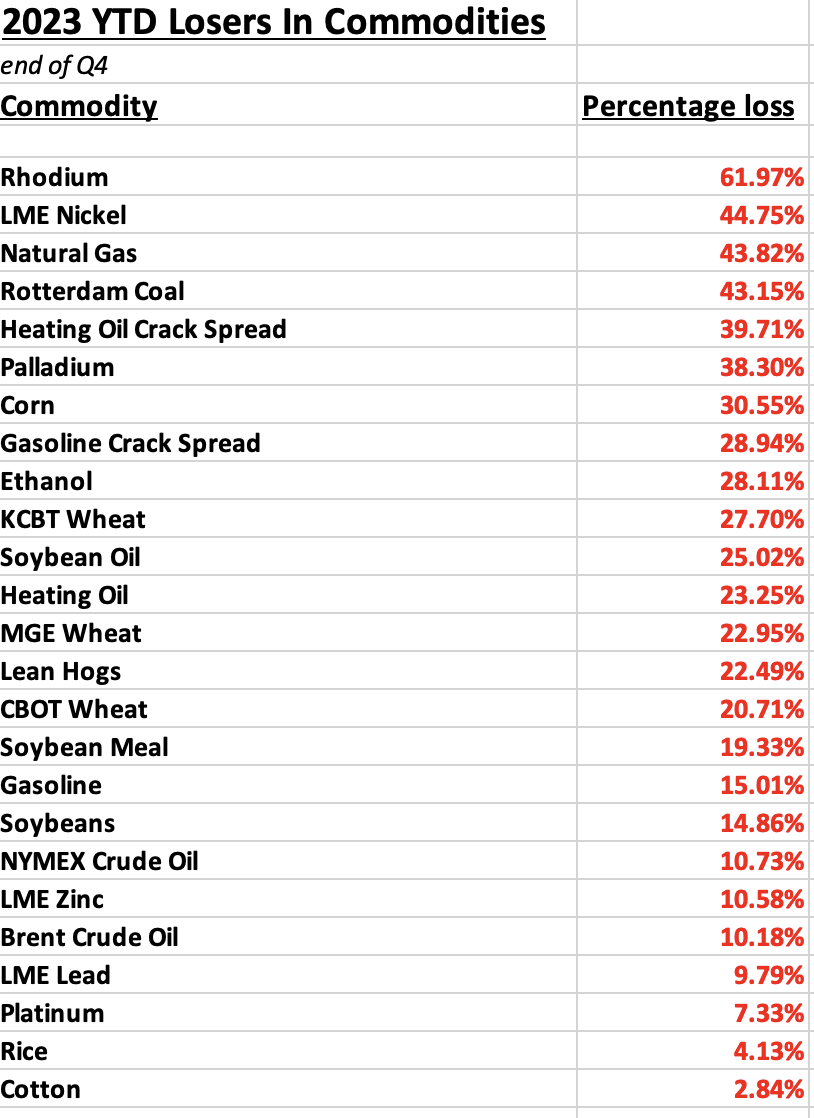
The outlook for 2024: DBC is energy-centric
There are bullish and bearish factors facing commodities in early 2024. The bearish case is high interest rates, the global economic slowdown, and the overall consolidation in the commodities asset class in 2023.
On the bullish front, the prospects for lower interest rates, geopolitical turmoil, and a bullish trend since the 2020 pandemic-inspired lows support gains in the asset class.
The Invesco DB Commodity Index Tracking Fund ETF (DBC) declined with the asset class in 2023. While a composite of some of the most liquid diversified 29 U.S. and U.K. commodity futures fell 4.52%, the DBC product did worse.
Monthly Chart of the DBC ETF Product (Barchart)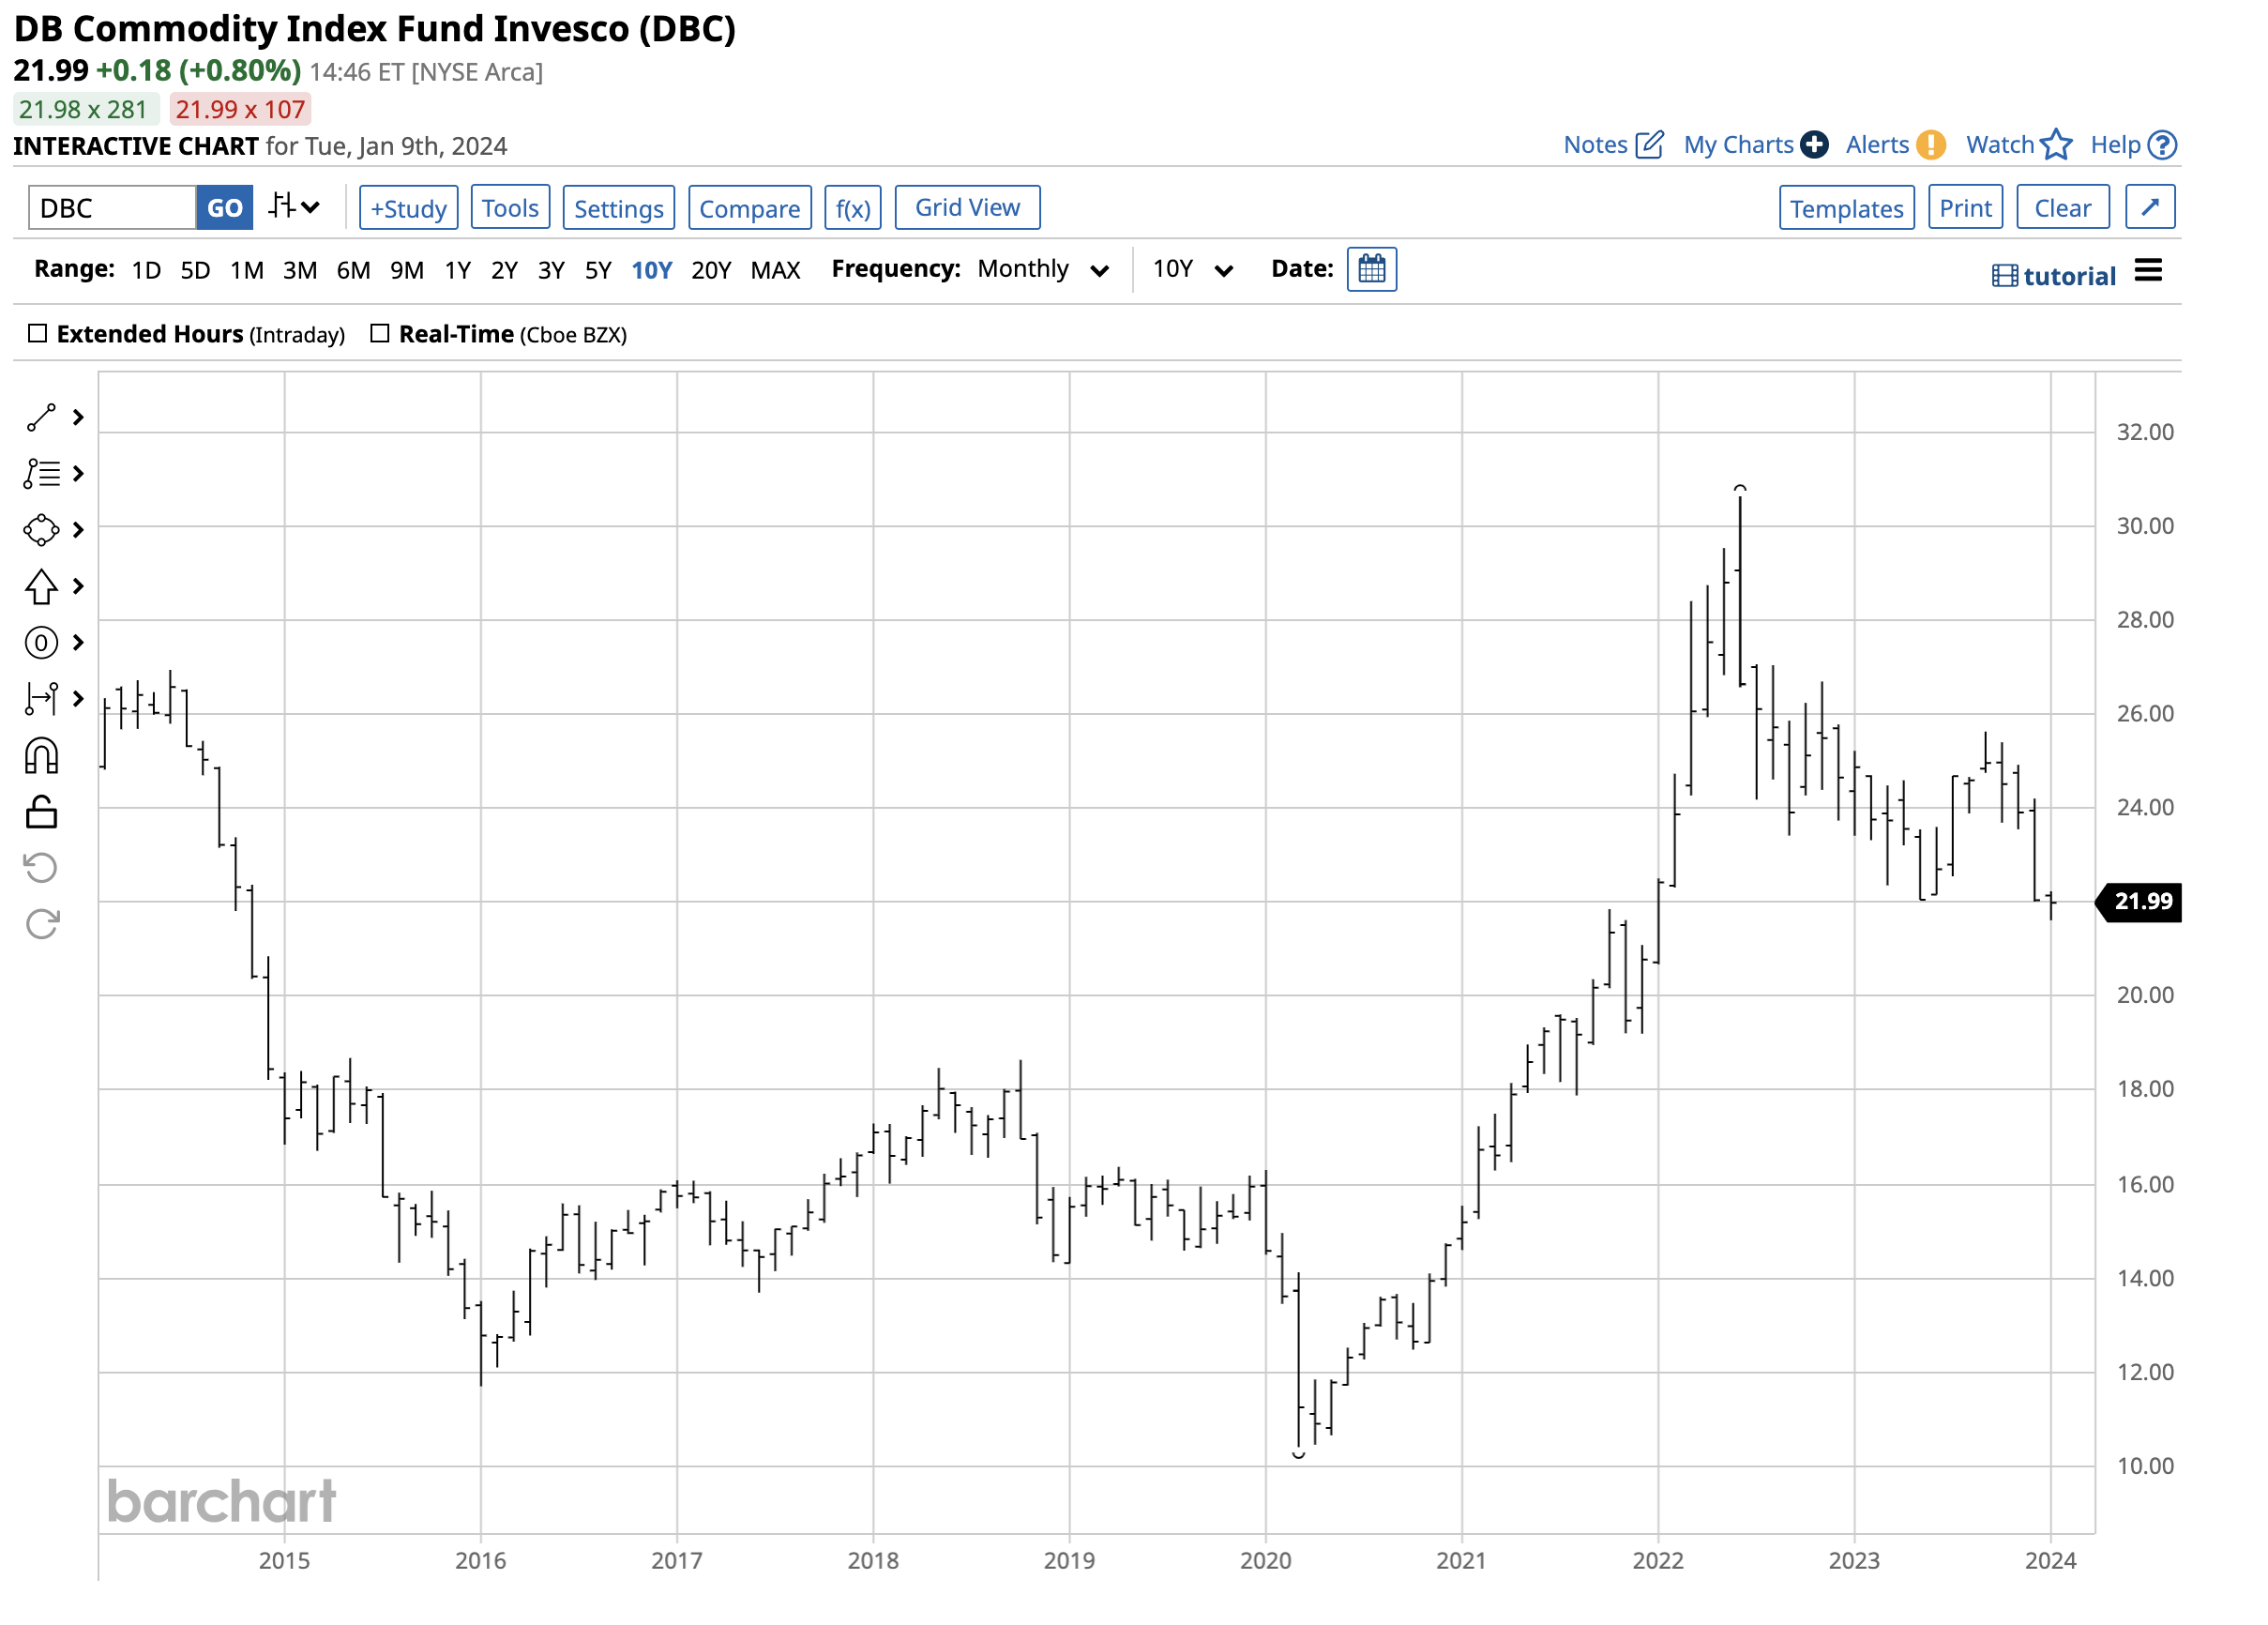
The 10-year chart highlights the 10.6% decline from $24.65 at the end of 2022 to $22.04 on Dec. 29, 2023. DBC underperformed the composite because it has a concentration in energy commodities, a sector that declined 21.85% in 2023.
At $21.99 per share on Jan. 9, DBC had $1.67 billion. DBC is a liquid product, trading an average of nearly 1.5 million shares daily. DBC’s top holdings include:
Top Holdings of the DBC ETF Product (Seeking Alpha)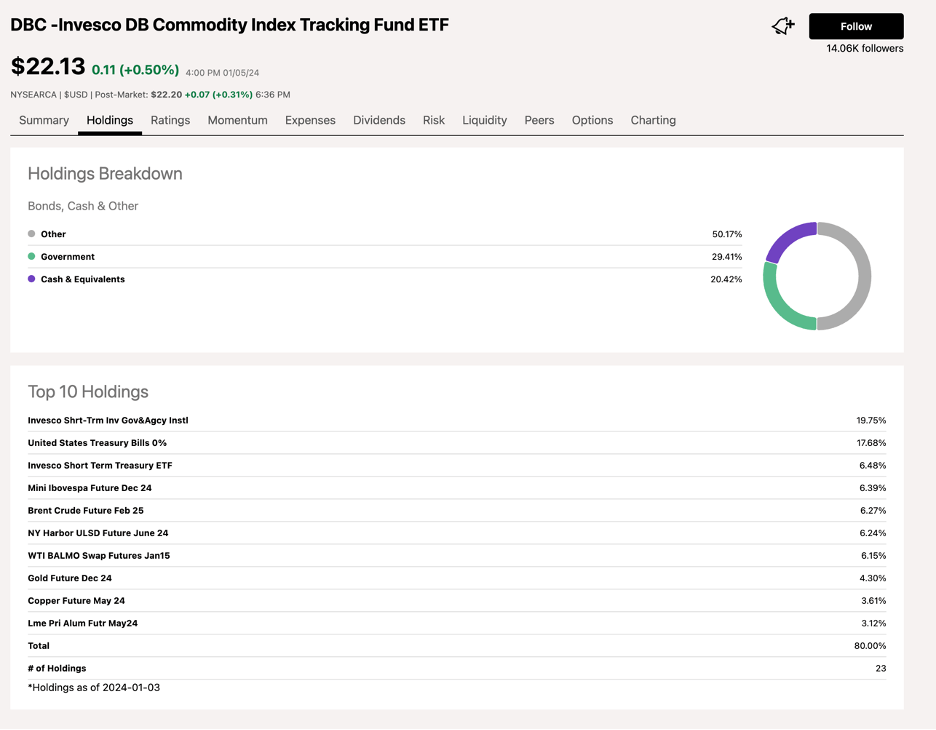
The chart shows DBC’s significant weighting towards traditional energy commodities.
DBC provides exposure to energy and other commodities, including gold, copper, and aluminum. If prices move higher in 2024, DBC will appreciate with the raw materials. DBC rose over 194% from the March 2020 $10.41 low to the June 2022 $30.64 high. DBC was slightly above the midpoint of that move. A broad commodity rally in 2024 could cause DBC to challenge the mid-2022 highs.


