(Bloomberg) — Global food prices are fresh off their biggest annual decline since 2015. However, disruptions at vital trade corridors including the Red Sea and Panama Canal will continue to pressure commodities, including everything from grains and edible oils to crude oil and gas. In Europe, higher-than-normal natural gas inventories are keeping a lid on price increases even as a cold front descends on the region.
Here are five notable charts to consider in commodity markets as the week gets underway.
Shipping
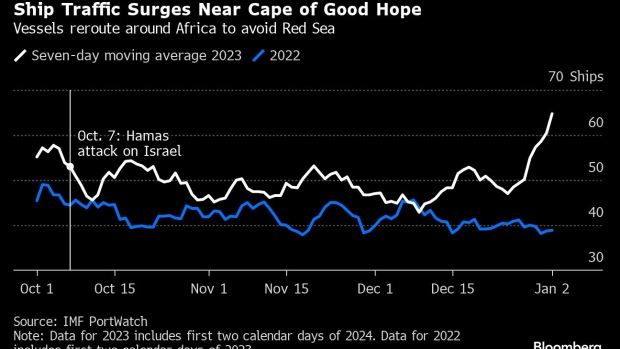
Ongoing tensions in the Red Sea are forcing many cargo vessels to avoid the key corridor that cuts transport times between Asia and Europe. That means logging hundreds of extra miles — and higher costs — in the quest for safer waters, away from the missile strikes of Yemen’s Iran-backed Houthi militants. Since late December, traffic around Africa’s Cape of Good Hope has surged, according to IMF PortWatch data. Meanwhile, Suez Canal transit volumes dropped 28% from a year earlier in the 10 days through Jan. 2.
Natural Gas
Temperatures may be falling in Europe, raising the prospects of increased demand for the heating and power-plant fuel, but ample stockpiles should keep prices in check in the short term. Natural gas storage levels are currently about 86% full — above the five-year average. Even so, the escalating situation in the Red Sea and unpredictable weather will keep traders on edge, with implied volatility in benchmark Dutch contracts creeping higher to start the new year. Futures have been trading in a largely sideways pattern in recent weeks — and below key moving averages — a stark contrast from the record surge of 2022 during the region’s energy crisis.
Energy Stocks
The potential for continued underperformance by the S&P 500 Energy Index is strengthening from a technical standpoint, according to Bloomberg Intelligence. The gauges’s ratio versus the broader S&P 500 Index has formed a head-and-shoulders pattern by closing below support — the neckline of the formation — after setting three highs, with the middle peak (H) above the other two (S1 and S2). That suggests further downside. The ratio needs to hold below the neckline for the bearish chart to remain intact. Adding further pressure, it endured a so-called death cross last month, when the 50-day moving average trades below the 200-day measure. The gauge tracking 23 energy companies including Exxon Mobil Corp., Chevron Corp. and ConocoPhillips fell nearly 5% last year after surging 59% in 2022.
Oil
The US Energy Department is slowly refilling the Strategic Petroleum Reserve, which was drained in 2022 after the Biden administration’s historic release of 180 million barrels in an effort to tame high oil prices after Russia’s invasion of Ukraine. The world’s largest stash of emergency supplies now stands at about 354.4 million barrels, according to Energy Information Administration data. But as West Texas Intermediate futures rally amid tensions in the Middle East, that runs the risk of thwarting replenishment if prices rise too high. The US has been buying crude for the SPR at an average of $75 a barrel after selling millions of barrels in 2022 at an average of about $95 a barrel. WTI settled last week at $73.81 a barrel.
Food Inflation
Relief may be in sight for consumers. The United Nations’ food price index, which tracks five major exported raw commodity groups, fell 10% last year and is now at the lowest level in almost three years. Even so, food inflation is very real — the index is still above the 10-year average — and it takes time for these decreases to filter down to the retail level at supermarkets, where prices remain elevated globally due to energy, labor and transport costs.
–With assistance from Anthony Feld, Gina Martin Adams and Catherine Traywick.
©2024 Bloomberg L.P.


