
- Stagflation risk is still lingering as indicated by the latest April US ISM Manufacturing and Services PMI data.
- A not fully priced-in stagflation risk scenario may support another bullish impulsive upmove sequence for Gold (XAU/USD).
- Watch the key medium-term pivotal zone of US$2,260/2,210 for Gold (XAU/USD).
This is a follow-up analysis of our prior report, “Gold Technical: Is the bull run over after its worst daily decline in 2 years?” published on 24 April 2024. Click here for a recap.
Since our last publication, Gold (XAU/USD) has inched lower to print a low of US$2,277 last Friday, 03 May. All in all, it has declined by -6.3% from its current all-time high of US$2,431 on 12 April amid key risk events and data such as the outcome of Fed Chair Powell’s monetary policy press conference and the US non-farm payrolls jobs date for April.
Stagflation risk is still “alive”
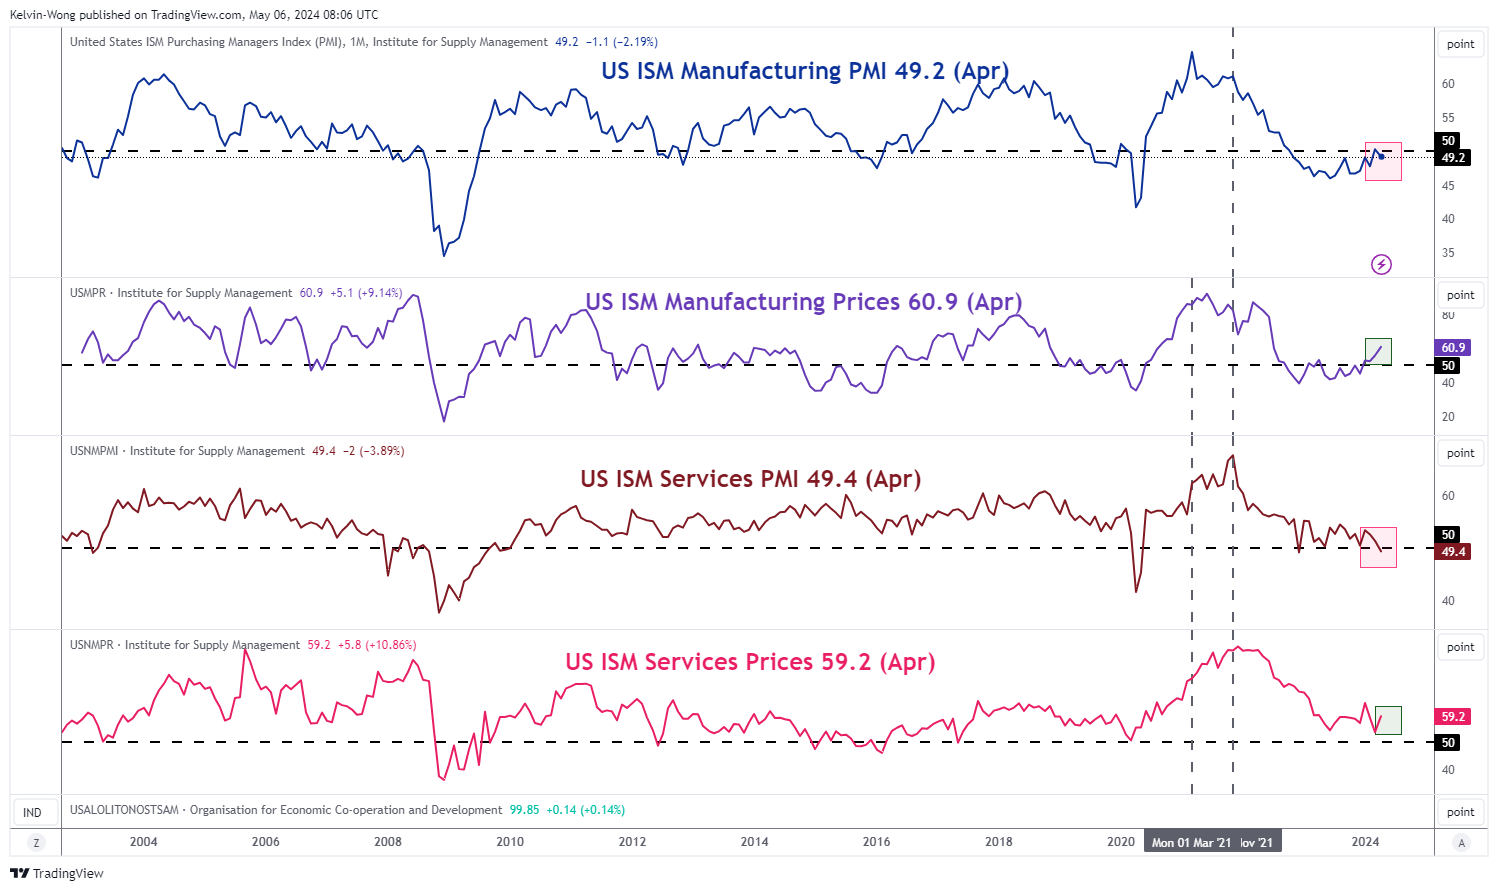
Fig 1: US ISM Manufacturing and Services PMI data as of 3 May 2024 (Source: TradingView, click to enlarge chart)
The markets do not seem to pay much attention to the US ISM Services PMI data which is considered a leading economic indicator to gauge the state of the US economy. Market participants embraced a risk-on behaviour mentality triggered by a weaker-than-expected April NFP that added only +175K jobs, below the consensus of +243K, and below March’s print of +315K which suggests that the US jobs market is still expanding at a brisk pace that reduces the odds of an interest rate hike by the Fed; a state of “Goldilocks” scenario for the US economy.
On the other hand, the services sector which contributes close to two-thirds of US economic growth is showing signs of an acute slowdown as indicated by the latest data from the US ISM Services PMI that contracted to 49.4 in April, its first contraction since December 2022, below consensus of 52.0.
In addition, one of its sub-components, the ISM Services Prices (considered as a gauge of business costs for the services sector in the US) rose to 59.2 in April from 53.4 in March and above expectations of 55.
Overall, we have seen similar trends in April ISM Manufacturing PMI and its Manufacturing Prices sub-component albeit at a steeper pace of increase versus Services Prices (see Fig 1).
These latest data points suggest a potential stagflation environment akin to the 1970s when the Fed had its hands tied to prevent it from enacting an accommodating monetary policy which in turn may support the ongoing major bullish trend in Gold (XAU/USD) in place since September 2022.
Positive technical elements have resurfaced
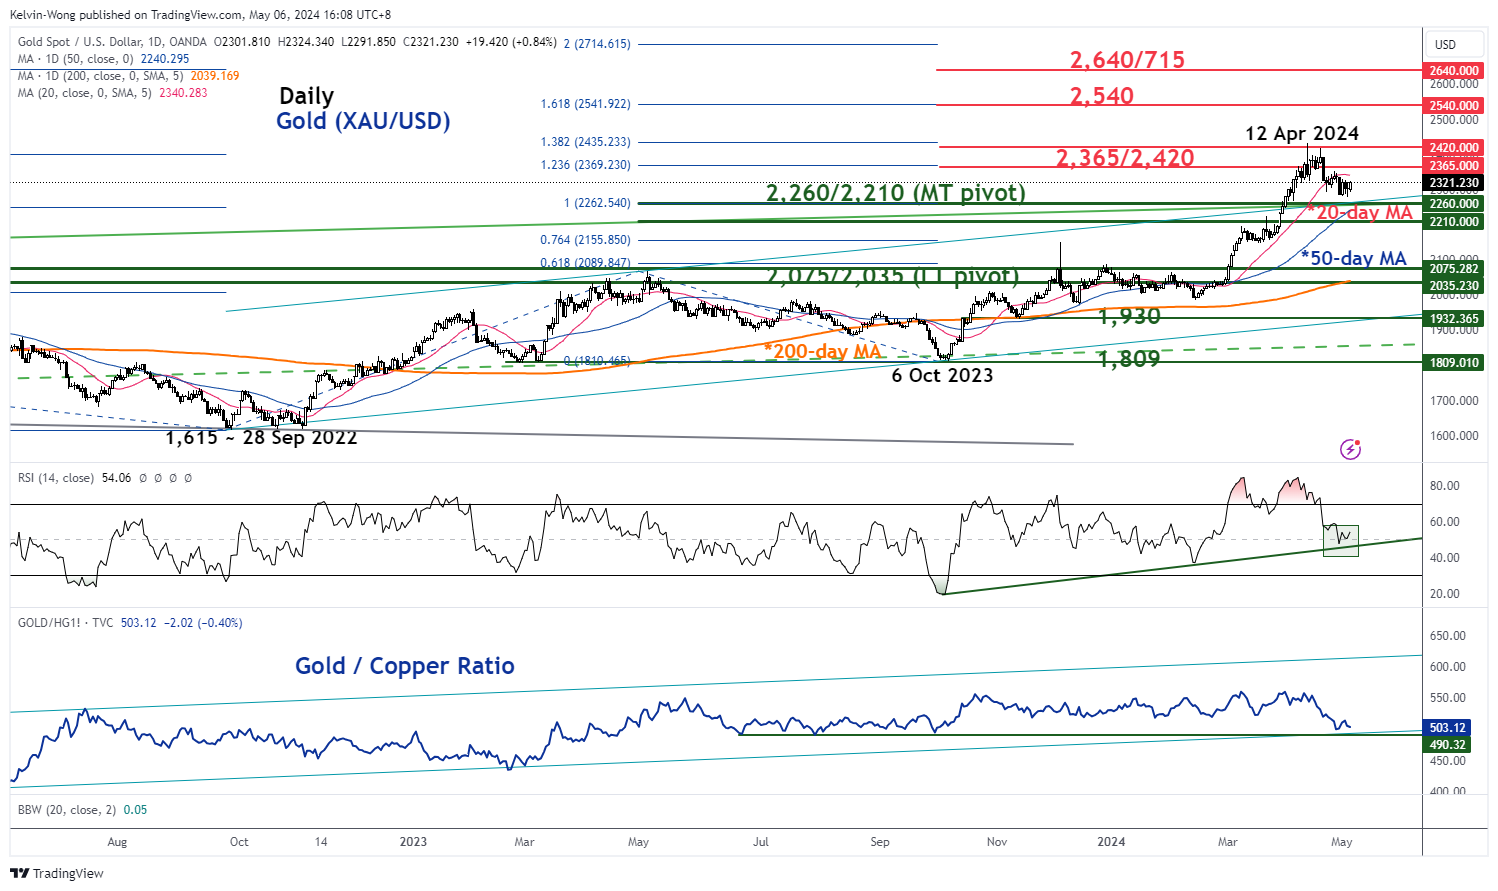
Fig 2: Gold (XAU/USD) major & medium-term trends with Gold/Copper ratio as of 6 May 2024 (Source: TradingView, click to enlarge chart)
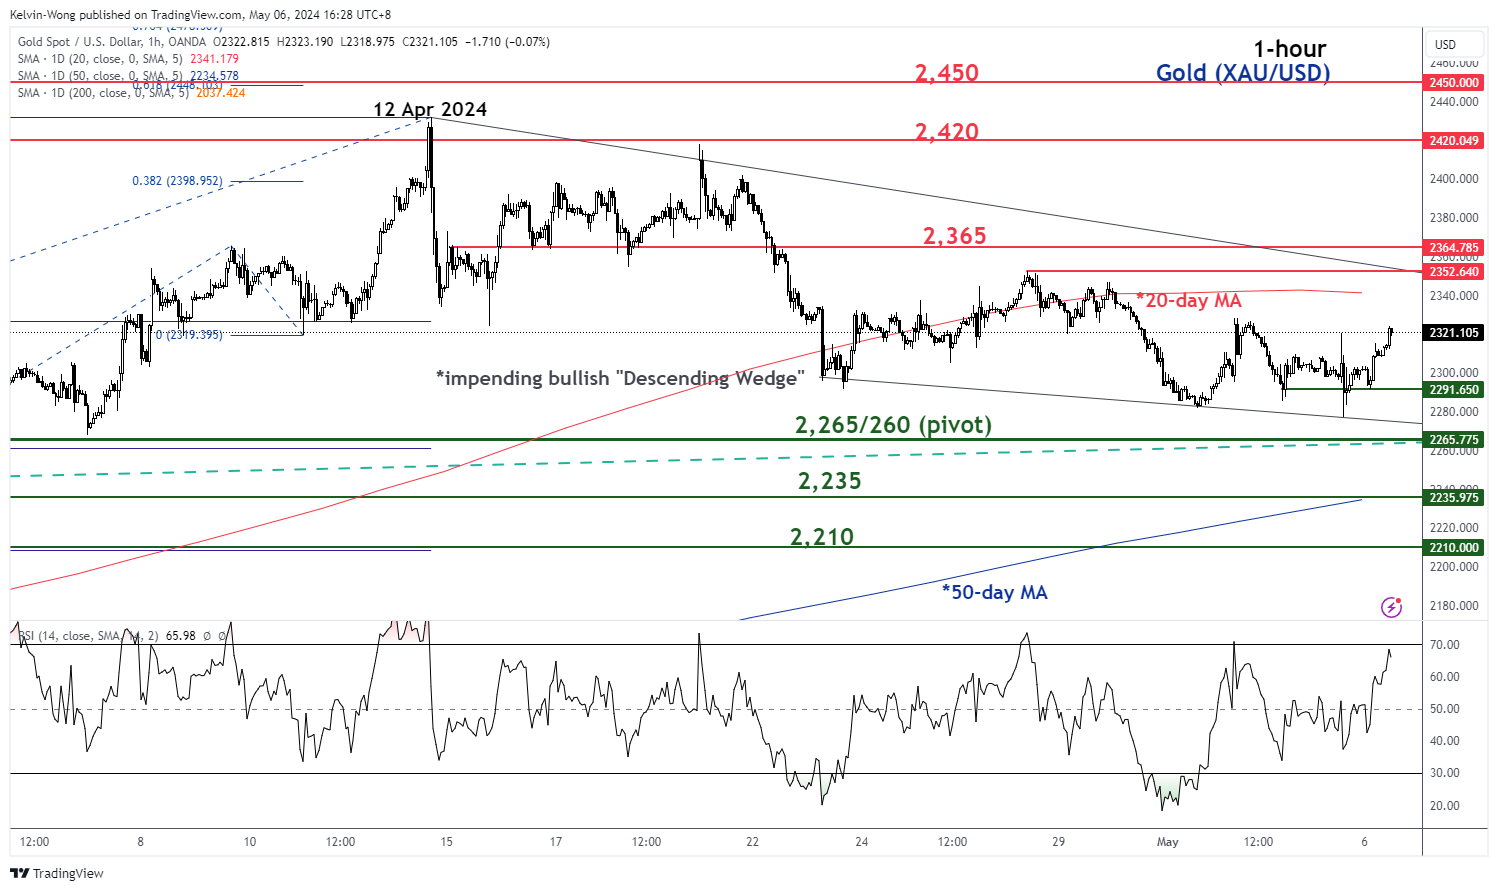
Fig 3: Gold (XAU/USD) short-term trend as of 6 May 2024 (Source: TradingView, click to enlarge chart)
The daily RSI momentum indicator of Gold (XAU/USD) has shaped a rebound right above a key parallel ascending support at around the 50 level which suggests a positive medium-term momentum revival while price actions are still holding above the 50-day moving average, an indication that the medium-term uptrend phase in place since 14 February 2024 is still intact (see Fig 2).
Secondly, the short-term corrective pull-back from the 12 April 2024 all-time high of US$2,431 has transformed into a potential bullish “Descending Wedge” configuration since 26 April which implies that the short-term downside momentum inherent in the two weeks of corrective pull-back has started to ease.
Watch US$2,260 (upper limit of the medium-term pivotal support) and the first short-term hurdle the bulls face is likely the US$2,350/365 near-term resistance zone. A clearance above it sees the next immediate resistance coming in at US$2,420 (current all-time high area) and US$2,450 in the first step (see Fig 3).
However, failure to hold at US$2,260 may see an extension of the short-term corrective decline to expose the next supports at US$2,235 and US$2,210 (lower limit of the medium-term pivotal support & the 50-day moving average).
Content is for general information purposes only. It is not investment advice or a solution to buy or sell securities. Opinions are the authors; not necessarily that of OANDA Business Information & Services, Inc. or any of its affiliates, subsidiaries, officers or directors. If you would like to reproduce or redistribute any of the content found on MarketPulse, an award winning forex, commodities and global indices analysis and news site service produced by OANDA Business Information & Services, Inc., please access the RSS feed or contact us at info@marketpulse.com. Visit https://www.marketpulse.com/ to find out more about the beat of the global markets. © 2023 OANDA Business Information & Services Inc.


