

This is a follow-up analysis of our prior report, “Gold Technical: At risk of mean reversion corrective decline after 19% gain” published on 15 April 2024. Click here for a recap.
The price actions of Gold (XAU/USD) have shaped the mean reversion decline after a test on the US$2,420 intermediate resistance. It tumbled by -2.7% on Monday, 22 April, its worst daily performance since 13 June 2022 (almost two years), and continued to extend its losses in yesterday’s (23 April) Asian session.
So far, it has recorded an accumulated loss of -5.8% from its recent fresh all-time high of US$2,431 printed on 12 April to yesterday’s intraday low of US$2,291.
Now, the golden question for Gold (XAU/USD); can the bulls be revived or is it game over for its medium-term uptrend that kickstarted in mid-February 2024?
Let’s look at several positive elements that support its current medium-term uptrend phase.
Gold/Copper ratio remains on support within a rising trend channel
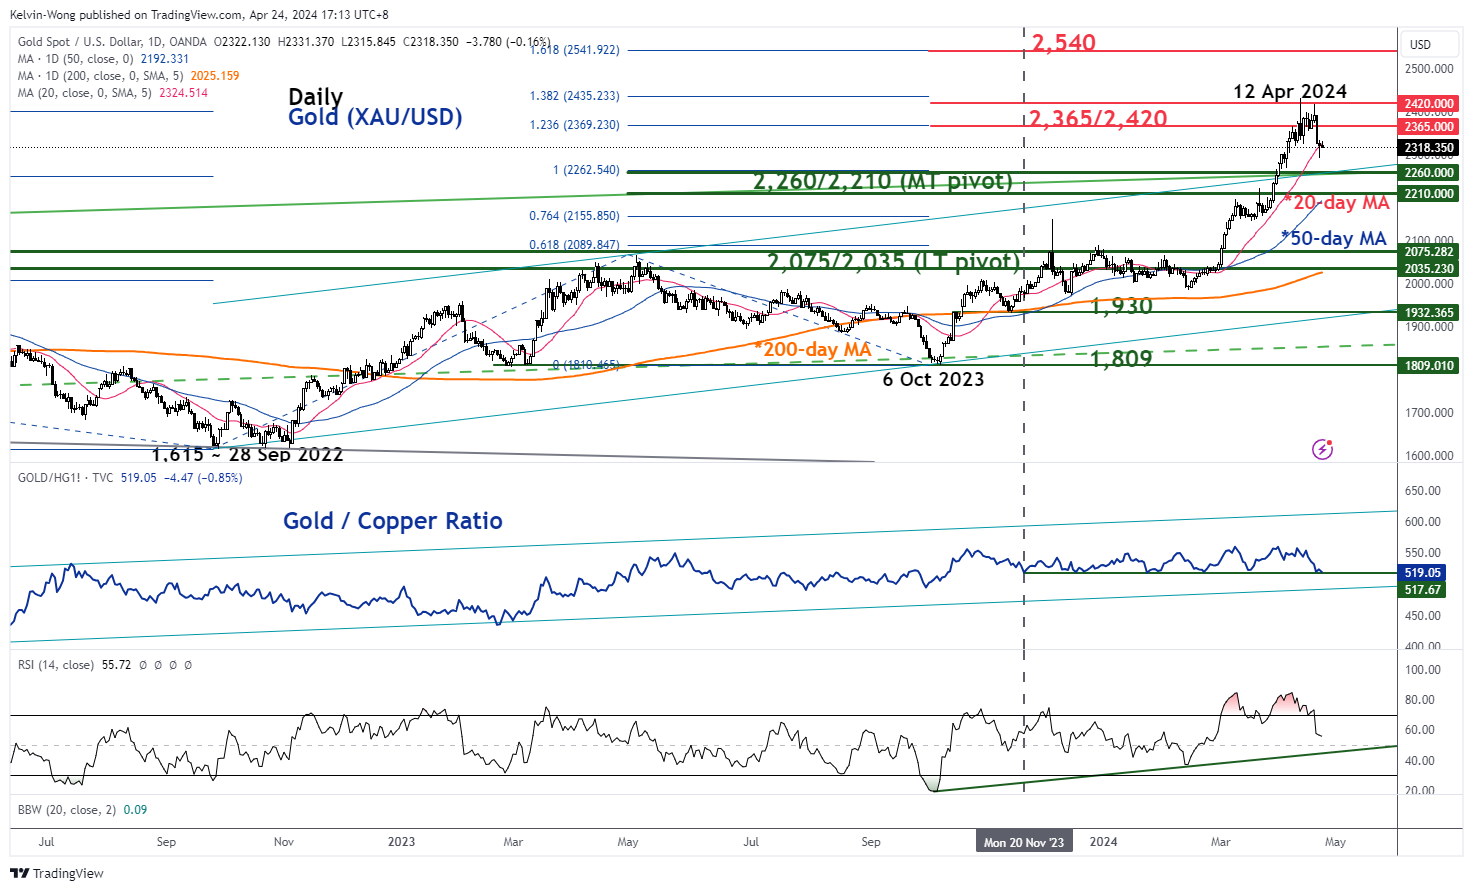
Fig 2: Gold (XAU/USD) medium-term trend with Gold/Copper ratio as of 24 Apr 2024 (Source: TradingView, click to enlarge chart)
The Gold/Copper ratio is defined by dividing the price of gold (XAU/USD) and the price of copper (I used high-grade copper futures denominated in USD). Hence the ratio removes the US dollar exchange rate effect from the equation which in turn solely measures the relative value or outperformance or underperformance of gold against copper.
Copper is considered an industrial commodity; hence its price trends reflect industrial demand and economic activities that stand in contrast with gold, a safe haven hedging asset/commodity with limited industrial usage.
If the ratio of Gold/Copper declines steadily, it suggests that global economic growth is likely in an expansionary mode, and vice versa when the Gold/Copper ratio rises due to a relatively higher demand for gold for hedging purposes due to economic growth slowdown or uncertainties.
The current state of the Gold/Copper ratio has so far remained on support since late November 2023 within a major ascending channel in place since 15 October 2021. Therefore, the current configuration of the ratio suggests that there is still a relatively higher demand for gold as a hedging asset for stagflation risk (see Fig 1).
Given the current economic context where inflationary expectations in the US remain sticky and elevated (above the US Federal Reserve’s 2% inflate target) which in turn puts the Fed in a “boxed up” situation that prevents it from enacting interest rate cuts aggressively. Therefore, fiscal expansionary policies will take over the driver’s seat to stimulate growth which in turn increases the federal budget deficit and may lead to a higher level of 10-year US Treasury yield (a long-term benchmark risk-free rate for pricing of corporate and consumer loans).
Higher costs of long-term funding or capital increase the “crowding out” effects that dampen internal demand which eventually slows down economic growth but not being able to offset sticky inflationary pressure due to persistent supply-side factors (geopolitical tensions & climate change that drive up the prices of oil and agriculture-related commodities).
The 50-day moving average is still acting as a support
Based on a technical analysis standpoint, the price actions of Gold (XAU/USD) are still trading above its 50-day moving average which confluences with a key medium-term pivotal support zone of US$2,260/2,210 that is defined by the former major ascending channel’s upper boundary from 28 September 2022, and the 38.2% Fibonacci retracement of the recent six-month impulsive upmove sequence from 6 October 2023 low to 12 April 2024 high (see Fig 1).
In addition, the daily RSI momentum indicator is still holding above a key parallel support at around the 50 level after its exit from the overbought region which suggests that the medium-term uptrend phase from 14 February 2024 low remains intact.
A clearance above US$2,420 may see the next medium-term resistance coming in at US$2,540. On the flip side, a break below the US$2,210 lower limit of the key medium-term pivotal support zone sees an extension of the ongoing corrective decline within its major uptrend phase to expose the long-term pivotal support zone of US$2,075/2,035 (also the 200-day moving average).
Content is for general information purposes only. It is not investment advice or a solution to buy or sell securities. Opinions are the authors; not necessarily that of OANDA Business Information & Services, Inc. or any of its affiliates, subsidiaries, officers or directors. If you would like to reproduce or redistribute any of the content found on MarketPulse, an award winning forex, commodities and global indices analysis and news site service produced by OANDA Business Information & Services, Inc., please access the RSS feed or contact us at info@marketpulse.com. Visit https://www.marketpulse.com/ to find out more about the beat of the global markets. © 2023 OANDA Business Information & Services Inc.


