

S&P 500 down 1.02% month-to-date
Each week, buy-side and sell-side analysts produce reams of charts and data visualizations to help contextualize price action across asset classes.
These data can help shape one’s thinking, offering evidence for increased conviction or criticism about currently held beliefs. Likewise, they may offer insight into relative risk/reward opportunities in various markets. These are the five charts that had an impact on my views on markets this week.
1. Global CTA positioning for global equities now in 100th percentile
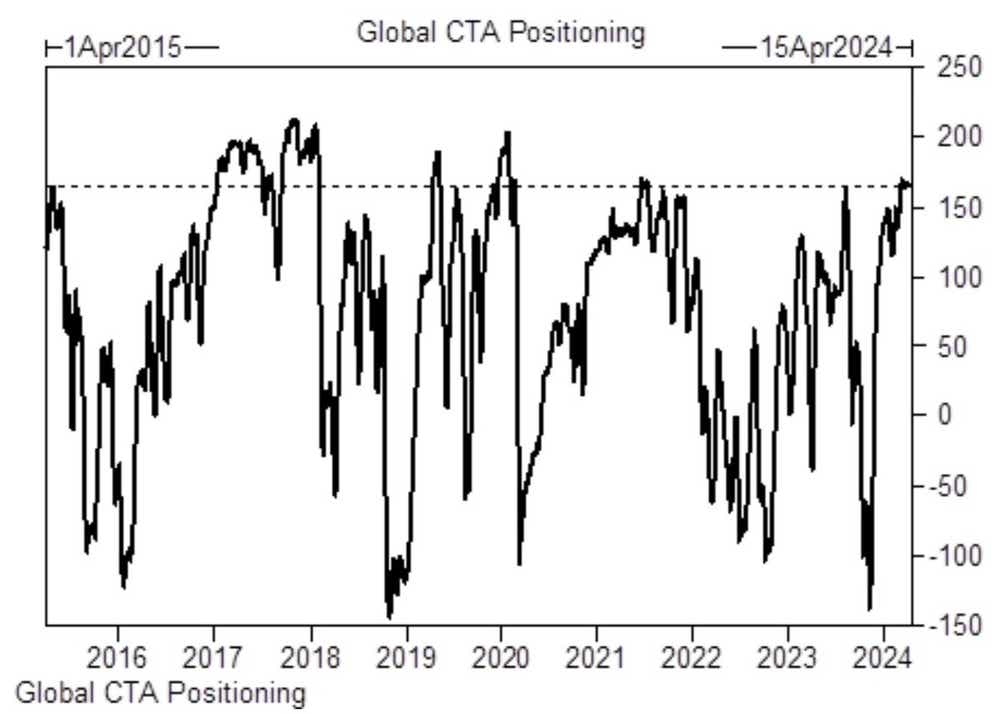
Takeaways: “We have CTAs modeled long $165 billion of global equities (100th percenttile) after buying +$364m last week,” notes Goldman Sachs’ equity and derivatives flows specialist Cullen Morgan. Why does this matter? The long side of the equities trade is extremely crowded. This crowding may help explain the ‘stair step up, elevator down’ type of price action seen in the S&P 500 (/ESM4) and Nasdaq 100 (/NQM4) over the course of the week.
Trade implications: U.S. equity markets are teetering on technical support (one-month moving averages). If we see a weekly close below these trend levels, trend-following CTAs may liquidate positions quickly. Alongside record concentrations in momentum stocks, this means downside price action–and expansions in volatility–could materialize quickly, if they do.
2. The global economy is poised for reacceleration
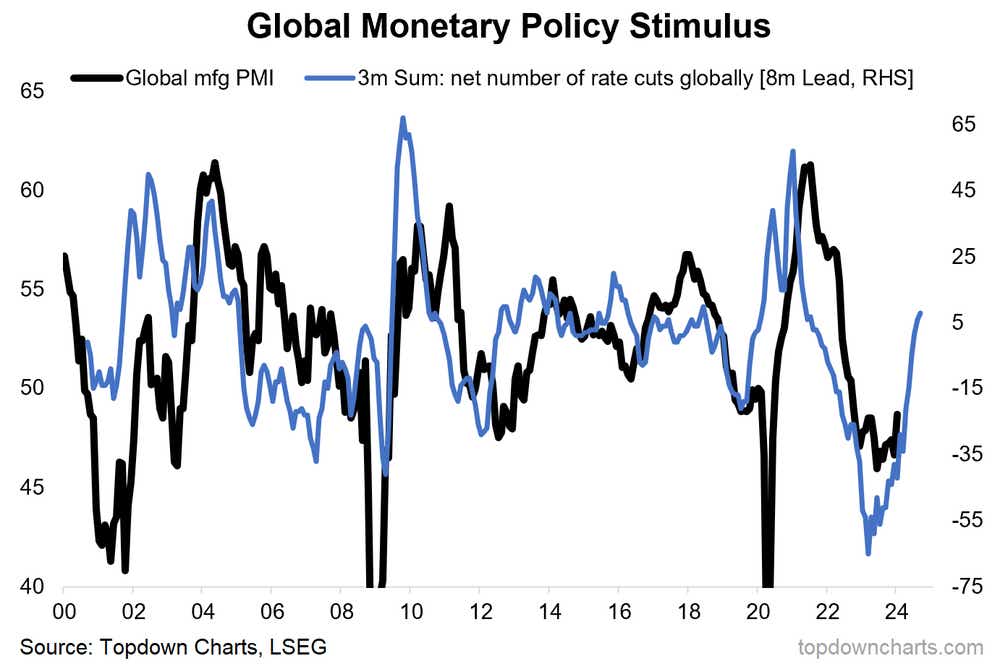
Takeaways: While expectations of global rate cuts have cooled in recent weeks, a sizeable number of reductions are still anticipated by markets. Historically, forward looking expectations for rate cuts corresponds with increasing economic activity, particularly out of the manufacturing secto
Trade implications: The recent breaks in commodity prices may not be done just yet. The exuberance seen in crude oil (/CLK4) and copper prices (/HGK4) in recent weeks may not be a reflection of geopolitical risks alone, but rather genuine optimism that the global economy will be on better footing than anticipated (mainly because of China’s nascent rebound). If we’re in the early innings of global reacceleration, the recent breakout in commodity prices may still have upside potential over the next few months.
3. Inflation looks likely to turn higher – DB Commodity Index Tracking Fund (DBC) continues breakout
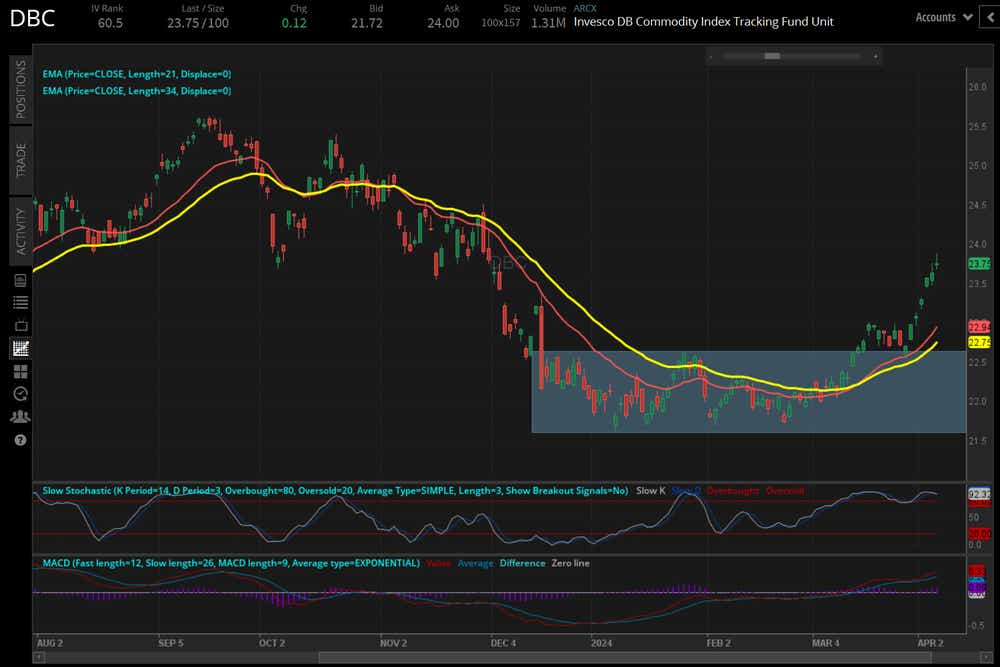
Takeaways: First covered in mid-March, the rally seen in the Deutsche Bank Commodity Tracking Fund ETF, DBC, has only gained steam. While the reasons for this rally may be less about geopolitics and supply chain issues and more about expectations of an improving global economy, the rally nonetheless means that topline inflation pressures are likely to increase in the months ahead. There is a growing chance that the Federal Reserve doesn’t have the data in hand by June to justifying starting its rate-cut cycle.
Trade implications : Similar to above, where the fundamentals suggest that commodities may have a meaningful tailwind over the coming months, the technical picture suggests strong bullish momentum in the short-term. DBC’s largest components are energy products (56.27% of the basket), which is why it should be noted that 10s (/ZNM4) and 30s (/ZBM4) now have rolling one-month correlations equal to or less than -0.80 with /CLK4; if oil keeps climbing, pressure on the bond market is likely to remain.
4. U.S. crude oil production starts to dip
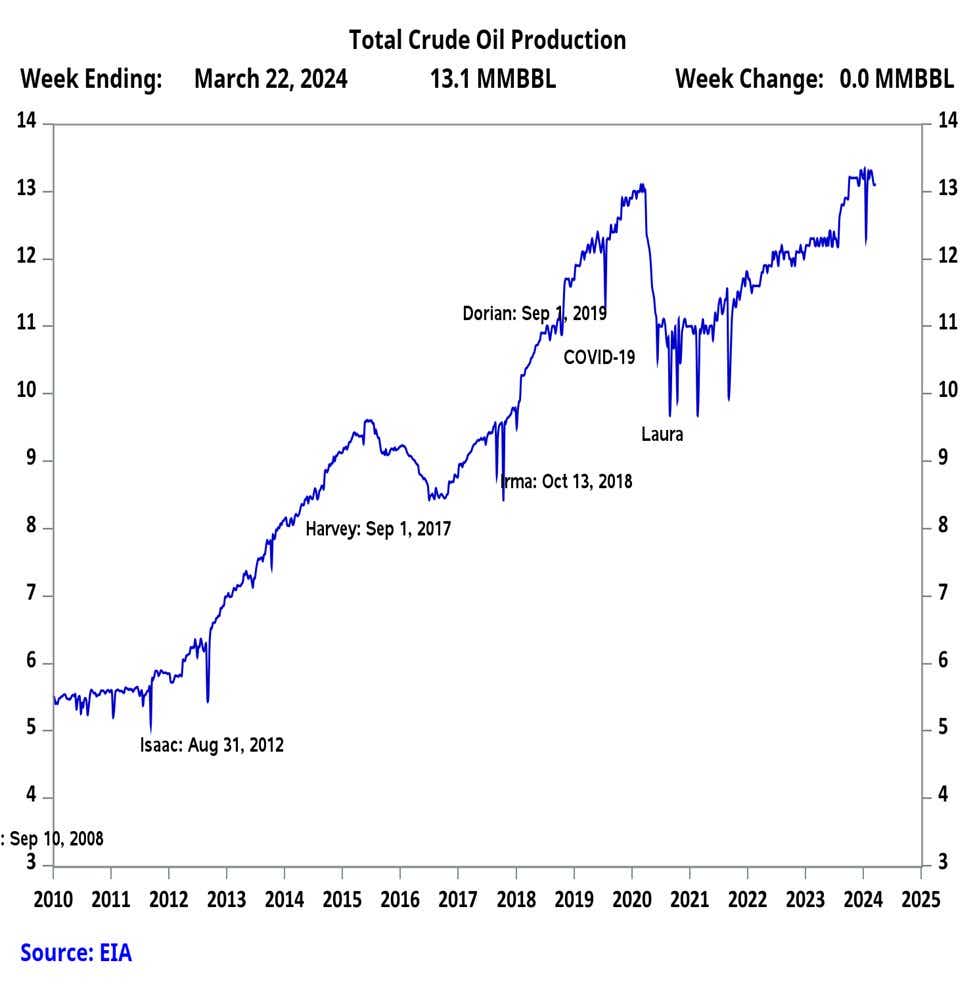
Takeaways: U.S. crude oil production recently hit new all-time highs just short of 13.5 million barrels per day. But after a wave of mergers and acquisitions in the energy sector, it appears that rig counts are starting to fall, leading to a decline in production output. While not significant thus far, a continuation of this trend–declining supply–at a time when global economic growth momentum appears to be accelerating–increasing demand–alongside geopolitical concerns between Israel and Iran may mean that energy prices have a meaningful floor underneath them in the short-term.
Trade implications: Crude oil prices (/CLK4) have broken out above the descending trendline from the June 2022 and September 2023 swing highs. A return to the September 2023 high at 88.25 feels almost inevitable at this point. Unlike the gains that accumulated since the start of the year, the leg higher in early-April has been accompanied by expanding volatility. This may inevitably pose a risk to bulls, as this may be a sign that geopolitical risk premia is back in the market (rather than gains being driven by supply/demand expectations alone). Once this geopolitical risk premia is realized–the event happens and risk is benchmarked, or the fear proves unnecessary–it could lead to corrective price action in oil. That said, a geopolitical-induced pullback in oil prices would appear to be an opportunity to fade the sell-off, should it transpire.
5. One for the bears: the U.S. economy may be slowing
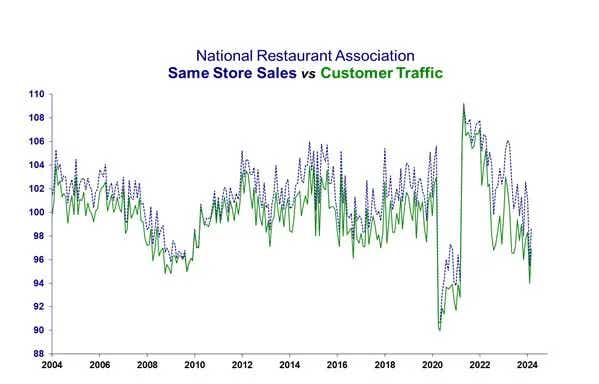
Takeaways: The U.S. economy appears to have grown at a 2.5% annualized real growth rate in 1Q’24, according to the Atlanta Fed GDPNow growth tracker. But that may only tell the story of where we’ve been, not where we’re going. The chart above produced by Steph Pomboy, sourced from the National Restaurant Association, shows that retail activity at restaurants is pulling back sharply at the start of 2024. In fact, the only times in recent history that the National Restaurant Association’s data series for Same Store Sales and Customer Foot Traffic were at these levels were during the depths of the coronavirus pandemic, and before that, the Global Financial Crisis.
Trade implications: The U.S. economy has a lot of momentum in the labor market thanks to immigration (legal or otherwise) and government spending (deficits of 6%+ of GDP). But there are cracks starting to appear among consumers as the continued strain of higher living costs forces families to crackdown on expenditures. In fact, restaurant stocks are feeling it too: EATZ, the AdvisorShares Restaurant ETF, is only up +3.96% in 2024; DRI, Darden Restaurants, owner of Olive Garden, Capital Grille, among others (if only to pick a name out of the hat) is down by -4.84% this year. The SPDR Consumer Discretionary ETF, XLY, is up a mere +0.02%, while XRT, the SPDR Retail ETF, is up just +3.25%. Compared to +9.07% for the S&P 500 (SPY), it’s clear that a consumer-facing stocks are offering a warning sign that the U.S. economy may indeed be slowing down–which may portend a bad second half of 2024 for U.S. equity markets (slower growth while inflation rises? Quite the quandary for the Fed).
Christopher Vecchio, CFA, tastylive’s head of futures and forex, has been trading for nearly 20 years. He has consulted with multinational firms on FX hedging and lectured at Duke Law School on FX derivatives. Vecchio searches for high-convexity opportunities at the crossroads of macroeconomics and global politics. He hosts Futures Power Hour Monday-Friday and Let Me Explain on Tuesdays, and co-hosts Overtime, Monday-Thursday. @cvecchiofx
For live daily programming, market news and commentary, visit tastylive or the YouTube channels tastylive (for options traders), and tastyliveTrending for stocks, futures, forex & macro.
Trade with a better broker, open a tastytrade account today. tastylive, Inc. and tastytrade, Inc. are separate but affiliated companies.


