

Bet_Noire
Investors looking for safe havens amid market uncertainty have poured money into a wide range of commodities to hedge against inflation, geopolitical risk, and natural disasters. Inflation concerns and tensions in the Middle East and Red Sea helped send gold to a record high in April and silver to a three-year high. Geopolitical tensions and droughts helped push base metal, energy, and agricultural commodity prices higher since early March. Cocoa spot prices reached an all-time zenith earlier in April and copper rose close to a two-year high. Gold is ~+13% YTD, silver +13%, copper +20%, and cocoa +130%.
Bloomberg Commodity Spot Index Performance YTD (Bloomberg)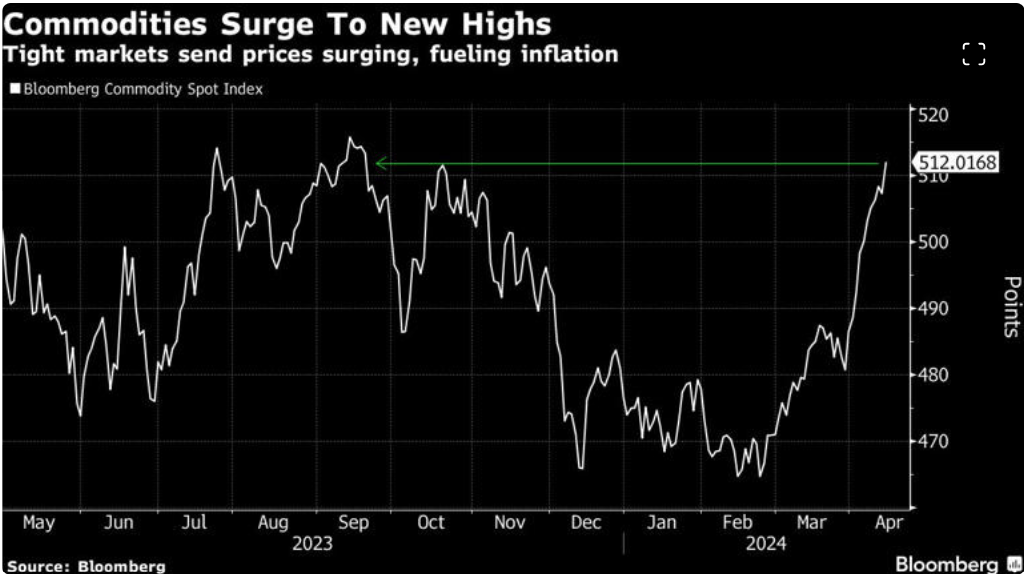
Precious metals (DBP), base metals (DBB), agriculture (DBA), and energy (DBE) commodity baskets have outperformed the S&P 500 YTD and in the past 30 days. The S&P 500 is down 2% in the past month and +7% so far in 2024.
Precious Metals, Base Metals, Ag, & Energy Commodity Basket Price Performance
Commodity Market Baskets Performance (SA Premium)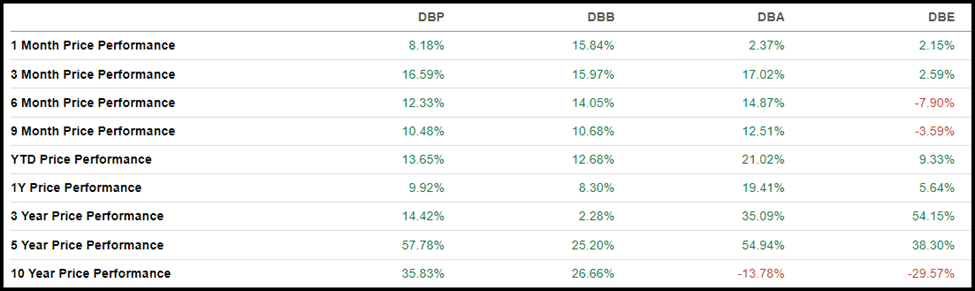
Commodities can serve as useful alternative investments amid market uncertainty but also come with their own set of risks. Commodities and commodity companies are highly cyclical assets and have the potential to be volatile, as they are susceptible to huge swings from hard-to-predict developments, such as wars and natural disasters. Seeking Alpha’s Quant Ratings aims to provide an instant characterization of each ETF by systematically collecting key metrics and grading them across five factors: Momentum, Expenses, Dividends, Risk, and Liquidity.
Top 5 Commodity ETFs
Investors can gain exposure to a single commodity or a basket of commodities through ETFs which employ two general strategies – direct commodity exposure or indirect exposure through sector equities, both of which have unique features.
Physically-Backed Commodity ETFs
- ETFs gain exposure by physically buying and storing commodities and/or engaging in futures contracts.
- Investing in physically-backed direct commodity ETFs affords exposure without worrying about the cost and hassle of product storage, transport, or trading contracts.
- Potential high risk comes with opportunity because investors feel the full brunt of the commodity’s daily price fluctuations.
Sector Equity ETFs
- Invests in stocks of companies that mine and/or produce the commodities.
- This approach could potentially be less risky as ETF portfolios typically contain dozens of companies so investors are not putting all their money in one basket.
- Commodities themselves do not generate profits, but companies profit from production and trading of commodities. Point being, other factors outside of commodity price are involved in sector equity ETF prices.
- Mining companies can take steps to mitigate (or exacerbate) the impact of commodity price fluctuations on the bottom line through hedging, pass-throughs, capital allocation decisions, cost reduction initiatives, among other means.
SA’s quant team has selected five Commodities ETFs, covering gold, silver, copper, uranium, and agriculture, with strong quant momentum factor grades and solid liquidity. Three of the ETFs have Strong Buy Quant Ratings, and two are quant-rated Buys. The ETF Quant Ratings are heavily driven by the Momentum Factor Grade, which, combined with high Liquidity scores, offset low marks in other categories.
1. iShares Gold Trust Micro ETF (IAUM)
-
Assets (AUM): $1.14B
-
Quant Rating: Buy
-
Quant Rating in Asset Class (as of 4/29/2024): 13 out of 60
-
Quant Rating in Asset Sub Class (as of 4/29/2024): 13 out of 41
IAUM is one of eight gold ETFs with Buy Quant Ratings in the Commodities Asset Class. According to Ole Hansen, head of commodity strategy at Saxo Bank AS, many investors see bullion as a hedge against inflation and geopolitical risk. Hansen said gold’s performance YTD has been driven by the Middle East crisis, the war in Ukraine, strong retail demand in China, and a potential reacceleration in the inflation outlook.
Gold Spot Price Surge Amid Mideast Tensions (Bloomberg)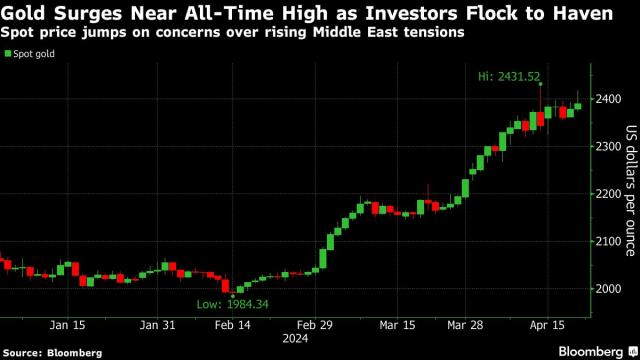
Incepted in 2021, IAUM offers exposure to the day-to-day price movement of physical gold based on the LBMA benchmark. IAUM holds 484,044 ounces of gold in a secure, segregated, allocated storage including fractional bars. IAUM is up 4% in the past 30 days vs. an ETF median of -2% and +17% in the past year, for an ‘A+’ Momentum Grade.
IAUM ETF Grades (SA Premium)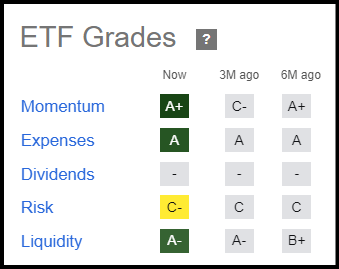
IAUM also gets an ‘A’ in expenses based on an expense ratio of 0.09%, approximately 80% less expensive than the ETF median of 0.48%. The bid/ask % spread of 0.04% is relatively narrow, indicating that the cost to execute a trade is low compared to the ETF median (0.14%).
IAUM ETF Expense Grade (SA Premium)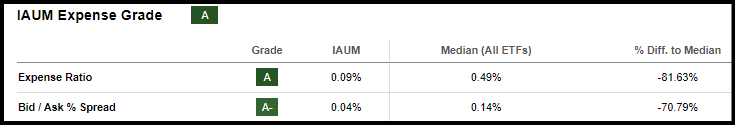
Its Liquidity Grade is a solid ‘A-’ with 1.2 billion in assets under management, and IAUM’s 3-month daily dollar volume of $17 million is well above the ETF median of $1.6 million. IAUM has a ‘C-’ Risk Grade with relatively high Y1 tracking error, measured as standard deviation between fund returns and the underlying benchmark index. However, IAUM in total returns TTM was within 1% of the market price and benchmark. IAUM total return for the 12 months ending 3/31/24 was +11.78% vs. market price return of +12.6% and reference benchmark return of +11.85%.
IAUM ETF Returns vs. Market Price and Benchmark Index (iShares)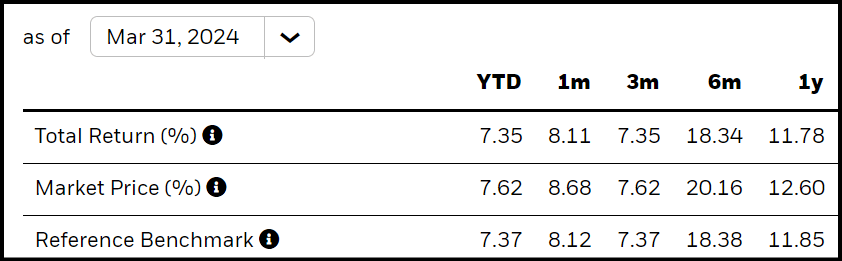
2. Sprott Uranium Miners ETF (URNM)
-
Assets (AUM): $1.75B
-
Quant Rating: Strong Buy
-
Quant Rating in Asset Class (as of 4/29/2024): 3 out of 396
-
Quant Rating in Asset Sub Class (as of 4/29/2024): 2 out of 40
URNM is ranked #3 among all quant-rated Sector Equity ETFs, and #2 in the Natural Resources Sub Class. URNM provides investors indirect exposure to the price of uranium through a portfolio of companies that produce the metal. URNM has seen explosive momentum, up ~70% in the past year, with demand for uranium projected to grow 28% from 2023-2030 as governments worldwide look to boost nuclear power capacity to achieve zero-carbon objectives.
URNM 1Y Price Performance (SA Premium)
URNM includes 42 constituents but is highly consolidated, with the top 10 holdings accounting for ~77% of the fund’s value and the top three making up 43%. The weighted average market cap is $5.5 billion, with 30% large cap and over 40% mid-cap. Top companies in the fund include Cameco Corporation (CCJ), National Atomic Co Kazatomprom (OTC:NATKY), China’s CGN Mining Co Ltd, Paladin Energy Ltd (OTCQX:PALAD), and Denison Mines (DNN). URNM not only invests in companies, but also allocates ~13% of funds to the commodity itself through the Sprott Physical Uranium Trust – Unit (OTCPK:SRUUF).
URNM ETF Top Holdings
URNM ETF Top Holdings (SA Premium)
URNM has an ‘F’ Risk Grade due to the huge % of assets (77%) in the top ten holdings and high tracking errors. For the 12 months ending 3/31/24, URNM NAV return was +63.46% vs. market price return of +64.48% and index return of +64.97%. URNM gets a D+ for expenses with an expense ratio of 0.75% and a Bid/Ask % spread of 0.37%.
3. Global X Copper Miners ETF (COPX)
-
Assets (AUM): $2.21B
-
Quant Rating: Strong Buy
-
Quant Rating in Asset Class (as of 4/29/2024): 2 out of 395
-
Quant Rating in Asset Sub Class (as of 4/29/2024): 1 out of 40
COPX is a Strong Buy sector equity ETF, incepted in 2010, with holdings consisting of over 40 pure-play copper producers and other diversified mining companies. COPX is up 28% YTD, and the price of copper (HG1:COM) +17%. Copper rose to $4.67/lb on April 29, a 2-year high, amid optimism over China demand, US-UK sanctions on Russian metal, disruptions in Brazil, Zambia and DRC, and potential structural long-term tailwinds driven by the global energy transition. According to the U.S. Department of Energy’s Critical Minerals Assessment report, by 2035 global copper demand could rise to about 35 million tons/year to as high as ~50 million tons/year, largely due to requirements for building EVs, wind turbines, and electric grids, with trajectories driven by differing rates of adoption, deployment, and material intensities of clean energy technologies.
Copper Demand Trajectories (U.S. Department of Energy – July 2023 Report)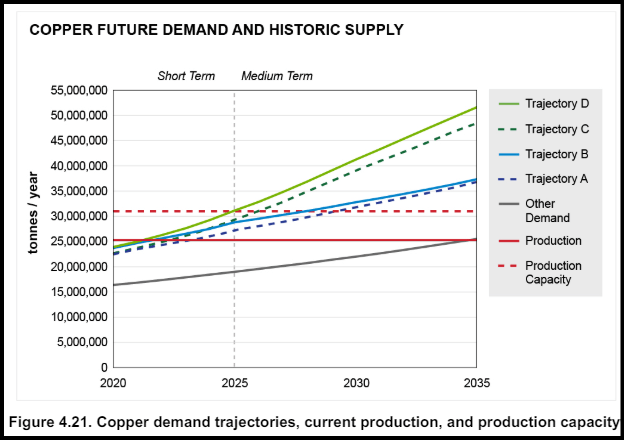
Meanwhile, fears loom underinvestment in mining projects could undermine the energy transition. In 2022, S&P Global Market Intelligence in its rocky road scenario projected copper shortfalls of nearly 10 million tons/year by 2035 and, according to a new report, looming deficits have been exacerbated by lower exploration budgets and a slowdown in drilling. Citi analysts wrote in a note that “only higher prices will solve these deficits,” as copper undergoes its “second secular bull market” this century, driven by booming decarbonization-related demand growth. Citi forecast the price of copper to rise to $10,500/t ($4.76/lb) over the next three months and $12,000/t ($5.44/lb) by 2026.
COPX’s fund has a weighted average market cap of $26.2 billion with the top ten holdings accounting for more than 50% of the fund’s value, led by Ivanhoe Mines (OTCQX:IVPAF), Lundin Mining (OTCPK:LUNMF), Antofagasta (OTC:ANFGF), Southern Copper (SCCO), Zijin Mining (OTCPK:ZIJMF), and FCX. COPX has ‘A+’ in Momentum, driven by 1M total return of 16% and a 6M return of 43%. COPX’s 5-year total return of +138% crushes the ETF median (+31%) and the price of copper (+61.2%).
COPX Momentum Grade (SA Premium)
COPX has an ‘A’ in Liquidity with AUM of $2.14 billion and an average daily value volume of $44.27 million. COPX ‘D+’ in Expenses based on an expense ratio of 0.65%, over 30% higher than the ETF median. COPX ‘D’ Dividends grade results from a dividend growth rate TTM of -20%, although the 3Y growth rate CAGR is over 30%, and the yield is ~2.00%. COPX ‘D-’ in Risk is due to a standard deviation of ~32 vs. the ETF median of 14 and tracking errors ranging from 25% to 27%. COPX NAV return in the 12 months ending 3/31/24 was 11.12% vs. market price return of +12.25% and index return of +11.97%. Another option for gaining access to the red metal is the physical commodity ETF United States Copper Index Fund, LP ETF (CPER), a Strong Buy that is +18% YTD, and now #1 in Commodities ETFs.
4. abrdn Physical Silver Shares ETF (SIVR)
-
Assets (AUM): $1.24B
-
Quant Rating: Strong Buy
-
Quant Rating in Asset Class (as of 4/29/2024): 3 out of 60
-
Quant Rating in Asset Sub Class (as of 4/29/2024): 3 out of 41
SIVR seeks to track the price of silver based on the LBMA benchmark and holds 44.63 million ounces of silver bullion bars stored in secure vaults. SIVR has As in Momentum and Liquidity and a ‘B’ in Expenses. SIVR is up 14% YTD and 8% in the past 30 days. The SIVR expense ratio of 0.30% is lower than other silver ETFs and almost 37% below the ETF median. Liquidity is solid, with $1.24 billion assets under management and $26 million average daily dollar volume. SIVR has a ‘D-’ risk score, driven by a standard deviation of 22.85 and tracking errors ranging from 17% to 29% for years SIVR NAV 1Y return ending 3/31/24 was +2.43% vs. market price return of +3.03% and benchmark return of +2.74%.
5. Invesco DB Agriculture Fund ETF (DBA)
-
Assets (AUM): $848.56M
-
Quant Rating: Buy
-
Quant Rating in Asset Class (as of 4/29/2024): 4 out of 60
-
Quant Rating in Asset Sub Class (as of 4/29/2024): 4 out of 41
DBA is the #4 in the quant-rated Commodities ETF asset class, showcasing A’s in Momentum, Dividends, and Liquidity. The fund uses derivatives such as exchange-traded futures contracts to invest in agricultural commodities. The top five holdings include cocoa (~25%), live cattle (11%), coffee (10%), soybeans (10%), and corn (10%), with the remainder spread across sugar, lean hogs, wheat, Kansas wheat, feeder cattle and cotton. The ETF for collateral invests in US Treasury bills, short-term Treasury bonds, and money market funds. Cocoa +130% YTD and coffee +22% have led the way for DBA. DBA’s A+ Momentum Grade is being driven by hot performance in the past 30 days, up 6% vs. the ETF median of -2%. DBA’s 1Y total return of ~30% outperforms the median by 128%. DBA has a solid long-term track record in momentum, up 47% in 3Y total returns and 72% in 5Y total returns.
DBA Momentum Grade (SA Premium)
DBA with an ‘A+’ Dividend Grade has a dividend yield TTM of 3.69%, a 1Y growth rate of 896%, and a 5Y CAGR of nearly 40%. Risk is a ‘C’ with standard deviation (15.6) in line with the ETF median and tracking errors per year ranging from 10-12%. DBA 1Y NAV return TTM (ending 3/31/24) was +26.82% vs. market price return of +26.68% and index return of +28.09%.
Concluding Summary
A wide range of commodities have outperformed the market so far in 2024 as the Fed signals inflation is here to stay, and supply constraints worldwide drive up prices of industrial metals and agricultural goods. SA’s Quant Team identified five Commodities ETFs with A+ Quant Momentum Factor Grades and solid liquidity across gold, silver, copper, uranium, and agricultural commodities. The ETFs are all Strong Buy or Buys and have an average YTD performance of +17%. In addition to top Commodity ETFs, if you’re seeking a limited number of monthly ideas from the hundreds of top quant Strong Buy rated stocks, the Quant Team’s best-of-the-best, consider exploring Alpha Picks.


