

US farmers have notably increased their purchase of animal, animal product, rainfall index, and area add-up insurance products over the last five years, thus broadening the set of commodities covered by the US farm safety net and providing an option for higher coverage levels. Furthering the use of these products will likely be a point of considerable discussion in the farm bill debate.
Data Source
Source for the data used in this article is USDA, RMA (US Department of Agriculture, Risk Management Agency). Their online data starts with 1989.
Insured Liability
Since the 2018 farm bill, the ratio of total farm insured liability to total farm cash receipts has increased the most of any five-year period since 1989: an 11-percentage point increase from 30% in 2018 to 41% in 2023 (see Figure 1).
Three newer products accounted for over one-third of the growth during this five-year period. Insured liability for animals and animal products increased by a factor of 26 times (see Figure 2). Moreover, its share of US animal and animal product cash receipts rose from near 0% to 11% (see Figure 1). Dairy Revenue Protection, which was first offered in 2019, and Livestock Risk Protection accounted for 37% and 50%, respectively, of the growth in animal and animal product insured liability.
Liability insured with Rainfall Index (RI) insurance more than doubled from $3 to $8 billion over 2018-2023 (see Figure 2). RI is available for pasture, rangeland, and forages, which has an animal insurance aspect to it, as well as for apiculture. It is based on weather data collected by the National Oceanic and Atmospheric Administration’s Climate Prediction Center. The index reflects how much precipitation is received relative to the long-term average for a given area and timeframe. In 2023, RI was purchased for nearly 300 million acres, plus over 3 million bee colonies.
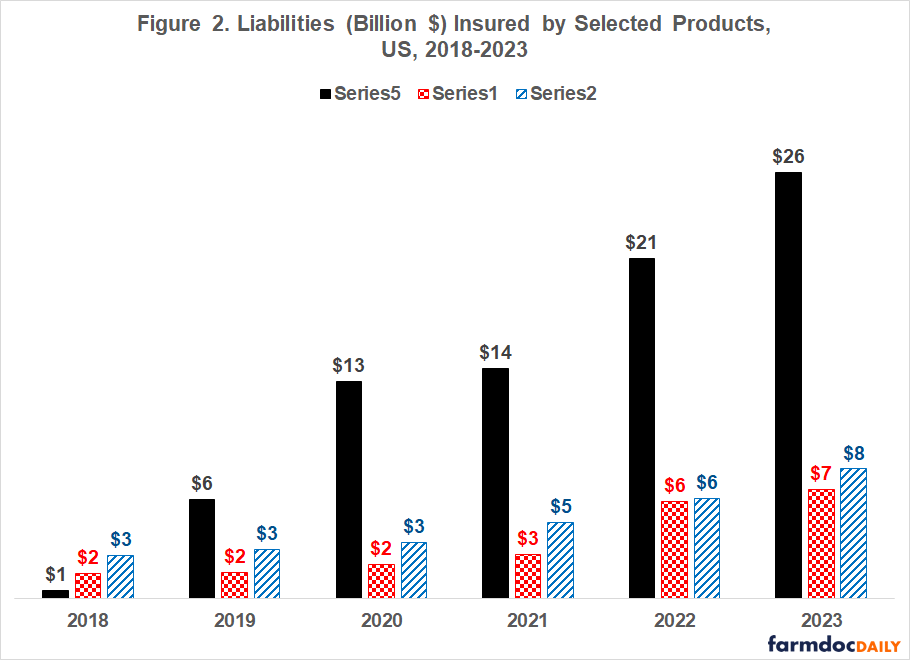
Liability insured with area add-up insurance more than tripled from $2 to $7 billion over the five years (see Figure 2). These insurance products add area coverage on top of individual farm insurance. There are currently four such products: ECO (Enhanced Coverage Option), MP (Margin Protection), SCO (Supplemental Coverage Option), and STAX (Stacked Income Protection Plan). SCO and STAX were the first. Both were authorized by the 2014 farm bill. To illustrate how area add-up insurance operates, assume a farmer buys 80% RP (Revenue Protection) coverage and 86% SCO coverage. SCO covers losses between 14% and 20% of the farmer’s area projected revenue. The area is often but not always a county.
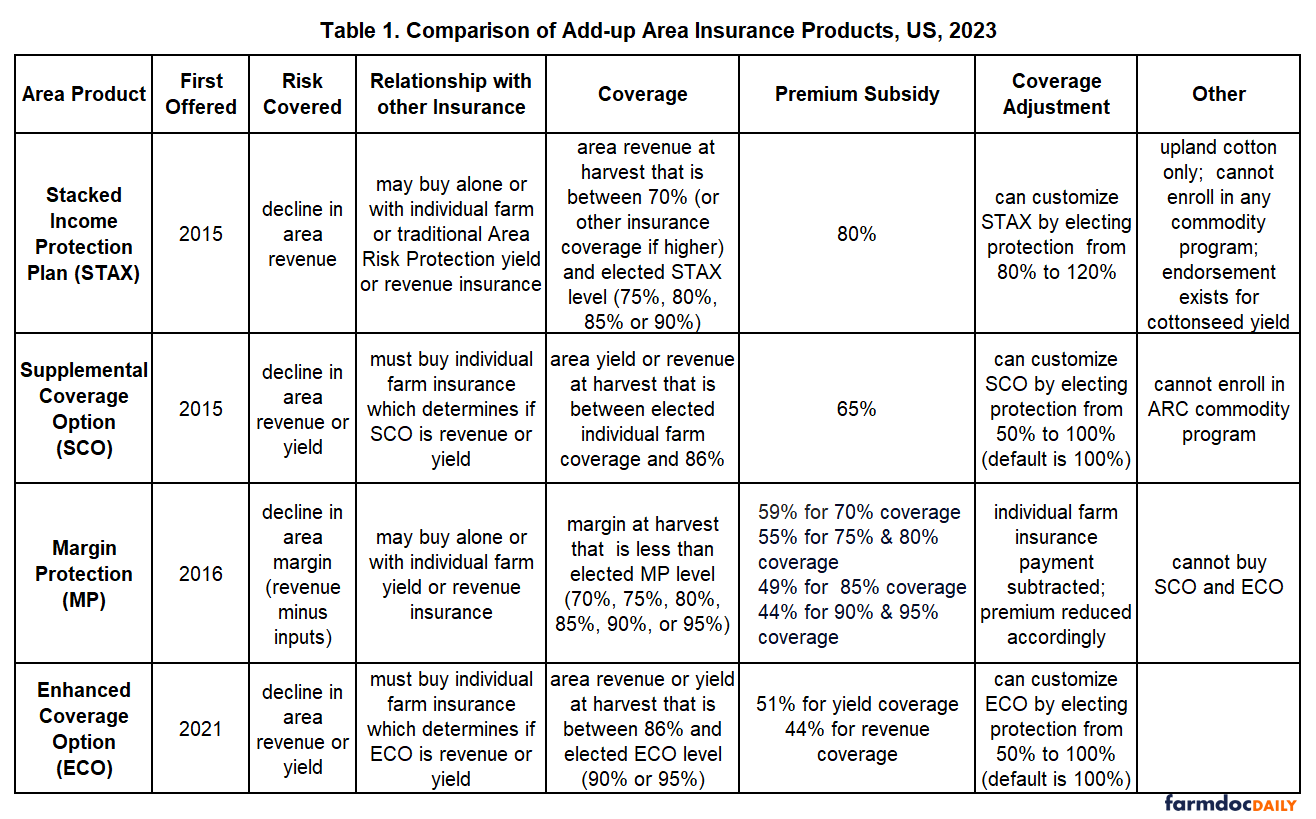
Table 1 at the end of this article contains a comparison of key features of the four add-up products. Three comparisons are noted. First, product provisions vary notably, including the risk covered. MP covers declines in the area’s margin (gross revenue minus cost of production). ECO and SCO cover declines in either revenue or yield. STAX covers declines only in revenue.
Second, relationships with other farm safety net programs vary. STAX is available only for cotton and the insured land cannot be in the ARC (Agriculture Risk Coverage) or PLC (Price Loss Coverage) commodity programs. SCO is not an option if the insured land is in ARC.
Third, the premium subsidy rate varies from 80% for STAX to 44% for both ECO revenue coverage and 90% and 95% MP coverage. ECO subsidy rate is 51% for yield coverage while the MP subsidy rate is as high as 59% for 70% coverage.
Figure 3 contains the share of insured liability that the four area add-up products accounted for in the 2023 commodity year for selected large acreage field crops. Share is highest for upland cotton. Eleven percent of all insured liability for upland cotton was in area-add up insurance. Area add-up insurance was purchased for 5.2 million upland cotton acres, with STAX accounting for 95% of these acres. Primary insured acres of upland cotton totaled 10.1 million. The large role of STAX in cotton is consistent with its subsidy rate of 80%. Next highest subsidy rate is 65% for SCO.
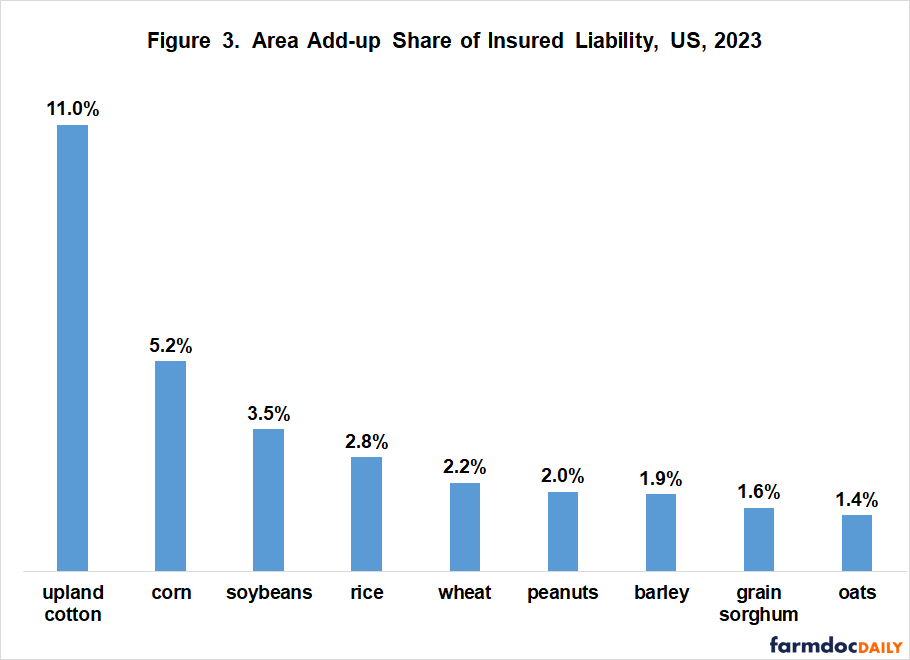
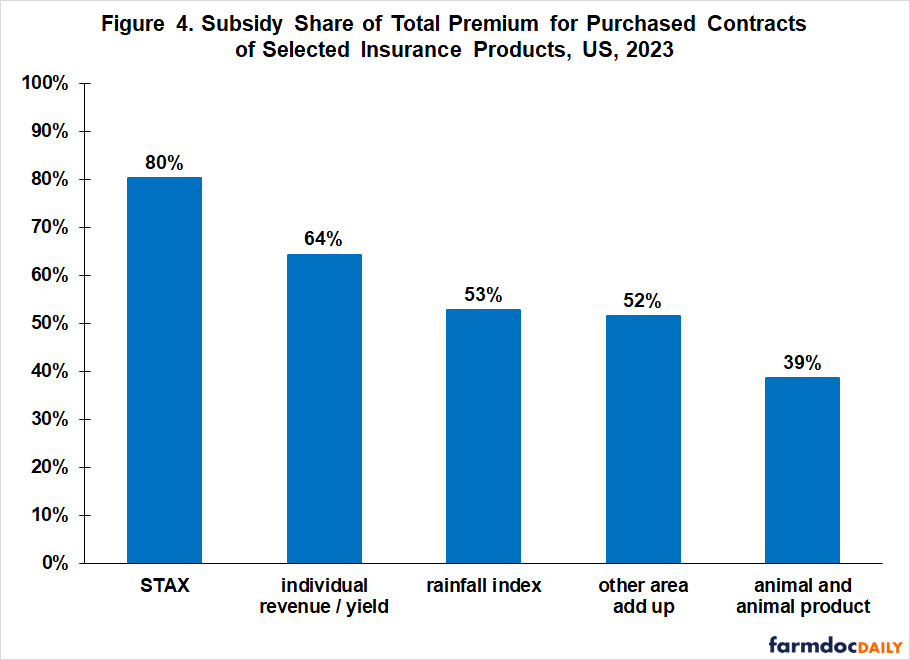
Figure 4 contains the subsidy rate for the insurance products mentioned in this article based on the insurance farmers bought for the 2023 commodity year. It ranges from 39% for animal and animal product insurance to 80% for STAX. The other area add-up products are ECO, MP, and SCO. For comparison purposes, the average subsidy rate for individual farm revenue and yield products is also presented. These products, traditionally the most commonly purchased RMA products, are APH (Actual Production History), RP (Revenue Protection), RPHPE (Revenue Protection Harvest Price Exclusion), and YP (Yield Protection).
Discussion
Over the last five years, the rapid growth in rainfall index, animal, and animal product insurance has transformed the US field crop insurance program into a US farm commodity insurance program.
A second trend has been the increasing use of area add-up insurance with higher coverage levels.
Both of these changes mirror recent ad hoc assistance. Non-program commodities have received an increasing share of ad hoc assistance (farmdoc daily of September 16, 2020, Figure 3) and ERP (Emergency Relief Program) has provided ad hoc assistance by increasing coverage for crop insurance purchased by farmers (farmdoc daily, June 6, 2022; June 7, 2022; and June 14, 2022).
The preceding point has policy significance since Increased ad hoc assistance has historically been a leading indicator of design change and more spending for the US farm safety net (farmdoc daily, July 29, 2020). If this historical indicator holds for the next farm bill, the US farm commodity insurance program should continue to broaden and higher coverage levels should become more attractive.
A reason for increasing subsidy rates for area add-up insurance instead of individual farm insurance is the important insurance considerations of adverse selection and moral hazard. They are less with area insurance since risk is covered at the area, not individual farm level. This reason is even more important at higher coverage levels since a qualifying risk event is more likely to occur.
Pursuing these two policy goals will likely be expensive. An obvious implementation strategy is to increase subsidy rates for existing insurance products that address these policy goals. For example, increasing the 2023 commodity year subsidy rates of 39% on animal and animal product insurance and 53% on rainfall index insurance to the 64% subsidy rate for individual revenue and yield insurance would have increased premium subsidies by $586 million, or by $5.9 billion over the 10-year farm bill budgeting period. Increasing the 2023 commodity year subsidy rate of 52% on ECO, MP, and SCO insurance to STAX’s 80% subsidy rate would have increased premium subsidies by $310 million, or by $3.1 billion over 10 years. These estimates are calculated using only the products purchased by farmers for 2023. They do not include any additional premium subsidies resulting from increased use of these insurance products in response to higher subsidy rates.
How to pay for or reduce the cost of higher subsidy rates becomes an obvious policy question. One potential option is to not subsidize HPO (Harvest Price Option) for area add-up insurance products. While farmers overwhelming choose HPO products, HPO has been a source of continuing, intense debate within the broader farm policy community.
Last, a decision to increase the role of current area add-up insurance products would likely prompt another policy question, “Should the current offering of area add-up insurance products be simplified by combining the non-MP products into a single product?”
US Department of Agriculture, Risk Management Agency Data Sources
ECO Fact Sheet. November 2020. https://www.rma.usda.gov/en/Fact-Sheets/National-Fact-Sheets/Enhanced-Coverage-Option
MP for corn, rice, soybeans, and wheat. Accessed December 7, 2023. https://www.rma.usda.gov/en/Policy-and-Procedure/Insurance-Plans/Margin-Protection-for-Corn-Rice-Soybeans-and-Wheat
SCO Fact Sheet. Revised January 2022. https://www.rma.usda.gov/en/Fact-Sheets/National-Fact-Sheets/Supplemental-Coverage-Option-2022
STAX Fact Sheet. July 2016. https://www.rma.usda.gov/en/Fact-Sheets/National-Fact-Sheets/Stax-Upland-Cotton
Summary of Business. January 2024. https://www.rma.usda.gov/en/Information-Tools/Summary-of-Business
References
Swanson, K., G. Schnitkey, C. Zulauf, J. Coppess and N. Paulson. “Continuous Disaster Aid Programs in U.S. Agriculture: A Policy Discussion.” farmdoc daily (12):89, Department of Agricultural and Consumer Economics, University of Illinois at Urbana-Champaign, June 14, 2022.
Swanson, K., G. Schnitkey, C. Zulauf, J. Coppess and N. Paulson. “Continued Discussion of Disaster Programs in U.S. Agriculture: Interactions with Crop Insurance.” farmdoc daily (12):84, Department of Agricultural and Consumer Economics, University of Illinois at Urbana-Champaign, June 7, 2022.
Swanson, K., G. Schnitkey, C. Zulauf, J. Coppess and N. Paulson. “The Continuation of Disaster Programs in U.S. Agriculture: Emergency Relief Program.” farmdoc daily (12):83, Department of Agricultural and Consumer Economics, University of Illinois at Urbana-Champaign, June 6, 2022.
Zulauf, C., G. Schnitkey, K. Swanson, J. Coppess and N. Paulson. “Trade and COVID-19 Ad Hoc Payments by Commodity.” farmdoc daily (10):166, Department of Agricultural and Consumer Economics, University of Illinois at Urbana-Champaign, September 16, 2020.
Zulauf, C., G. Schnitkey, J. Coppess, N. Paulson and K. Swanson. “Ad Hoc Payments: A Leading Indicator of Farm Policy Change.” farmdoc daily (10):140, Department of Agricultural and Consumer Economics, University of Illinois at Urbana-Champaign, July 29, 2020.

 Tunnel")
