Are we in a bubble in equities? And how do we know if so?
I’ve been on the road the past few weeks, meeting investors in both North and South America, speaking with allocators and fiduciaries about their most pressing challenges and opportunities. It’s striking that many of the conversations followed the same pattern. I found the B word cropping up in pretty much every meeting I attended, with clients wanting to know whether we at Man Group felt that there was a bubble in equities (and particularly in AI-related stocks).
Now here at Man we – quite deliberately – do not have a house view. We want our PMs to operate their strategies with freedom. This doesn’t mean that we don’t have opinions, but rather that we follow F Scott Fitzgerald’s definition of what is needed to operate in a complex world: “The test of a first-rate intelligence is the ability to hold two opposing ideas in mind at the same time and still retain the ability to function.”
It’s our job to absorb and synthesize the numerous viewpoints that exist within the firm and then communicate them to our clients in the round. When it comes to the bubble question, it’s possible both to acknowledge that there is some evidence of bubble-like characteristics forming, while recognizing that the idea of a bubble is of only limited use when it comes to timing investment decisions.
My colleague Henry Neville, a PM in our multi-asset business within Man Solutions, has long been a source of deep perspectives on market history. While I am occasionally skeptical of attempts to draw direct parallels between the market’s past and its present – the factors driving performance as well as the very fabric of the markets themselves have changed so dramatically – I also recognize the power of the long view, the wide perspective.
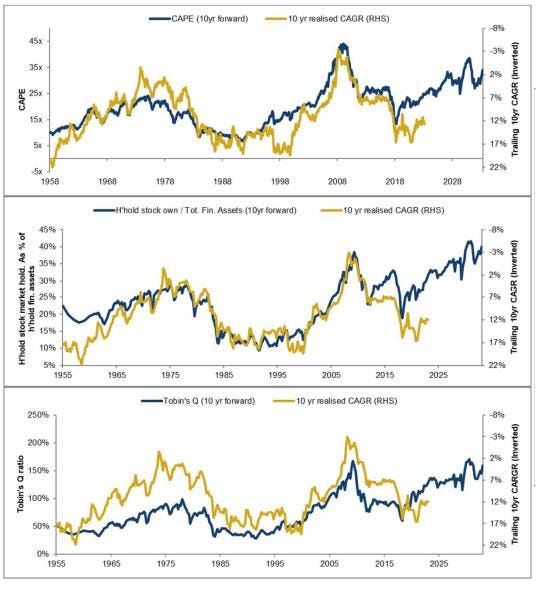
Henry pointed to three indicators which are often wheeled out as predictors of long term forward returns for equities. These are: the Cyclically-Adjusted P/E ratio identified by Robert Shiller (price divided by average inflation-adjusted earnings from the previous 10 years), Tobin’s Q (the ratio between the market value and replacement value of physical assets) and Household Stock Ownership as a proportion of financial assets. Below, I show these three metrics, advanced 10 years, against the inverted 10yr realized CAGR of the S&P 500.
Measures for Predicting Bubbles
Man Group
It doesn’t paint a pretty picture of where we are now. The three gauges imply nominal 10 year forward returns of somewhere between -4 and +3%, compared to the ~+12% that we’ve run at over the last 10 years. Of course, a 10-year average can obscure a great deal. Today the CAPE is 34, Household Stock Ownership is 40% and Tobin’s Q is 159%. What would have happened if we had used these thresholds as sell signals in the DotCom bubble (chosen because it’s the lazy comparator of choice)? In truth, the latter two don’t look at all bad as indicators. But valuation was no help. If you’d sold when the CAPE hit 34 you’d have missed out on around 45% of upside, itself almost the entirety of the ensuing burst. You’d be asking yourself why you bothered.
Measures through the DotCom bubble and burst.
Man Group
Another point to consider is that the account curves of the great historical bubbles differ wildly. Henry reminded me of an old paper he and our former colleague Ben Funnell wrote at the start of 2018. Below are three charts from this piece showing some of history’s great bubbles. Two things stand out to me. First, the wide variation in duration, and secondly, the wide variation in shape. While the Tulipmania, the South Sea Company and China A shares in the mid-noughties demonstrate the classic inverted triangle pattern, many others follow more nuanced paths.
The shape of historical bubbles
Man Group
Henry sent me the chart below, which aggregates all the above bubbles into one line. This gives us some useful heuristics on the anatomy of a typical bubble, which can be divided into 4 stages. In the first 40%, the price rises around 2.5x. The next 10% is the real euphoria zone, and we go from 2.5x to 6.0x in a hurry. The following 30% tends to be a bit of plateau, perhaps where the arguments for and against reach an equilibrium, before the crash comes in the last 20%.
We can debate where the AI stocks are in this playbook, or even whether they’ve even reached the starting blocks. But one more obvious observation strikes me: how near to the peak you have to be before it makes sense to try and time the bubble. Call the first half the inflation. Unless you are confident you are more than 70% of the way through it, you will ultimately make more money sitting tight, even with the pain on the way down.
Bubbles through time – consolidated
Man Group
Follow me on LinkedIn.


